很多exporter都是对机器或服务自身做监控,像是机器CPU利用率、redis内存利用率、网卡丢包率,这种都属于白盒测试
那么是不是会出现一种情况,各个方面的指标都没问题,但是服务就是访问不通呢?
这个时候就需要使用blackbox-exporter,作为一种黑盒测试的手段,能够在服务外部使用http tcp icmp https DNS探测等方式进行服务检查
https://github.com/prometheus/blackbox_exporter
1
2
3
4
5
6
7
8
9
10
11
12
13
14
15
| ┌──────────────┐ scrape /probe?target=X&module=Y ┌──────────────────────┐
│ Prometheus │ ────────────────────────────────────→ │ Blackbox Exporter │
│ │ │ │
│ (定时拉取) │ ←─── 返回 probe_* 指标 ────────────── │ (执行探测,返回指标) │
└──────────────┘ └──────────────────────┘
↑
│
blackbox.yml 只定义
探测"怎么做"(模块配置)
不定义"探测谁"(目标)
blackbox.yml — 定义模块(怎么探、用什么协议、超时多少)
prometheus.yml — 定义目标(探谁)+ relabel 把地址塞给 /probe?target=
Blackbox Exporter — 收到请求后按模块配置执行探测,返回 probe_* 指标
Prometheus — 存储这些指标,Grafana 展示
|
部署方式
二进制部署
1
2
3
4
5
6
7
8
9
10
11
12
13
14
15
16
17
18
19
20
21
22
23
24
25
26
27
28
29
30
31
32
33
34
35
36
37
38
39
40
41
42
43
44
45
46
47
48
49
50
51
52
53
54
55
56
57
58
59
|
wget https://github.com/prometheus/blackbox_exporter/releases/download/v0.28.0/blackbox_exporter-0.28.0.linux-amd64.tar.gz
tar -xf blackbox_exporter-0.28.0.linux-amd64.tar.gz
cp blackbox_exporter-0.28.0.linux-amd64/blackbox_exporter /usr/bin/
blackbox_exporter --version
blackbox_exporter, version 0.28.0 (branch: HEAD, revision: 5a059bee8d8ffa4e75947c5055fb0abeefc582e6)
build user: root@967d444a1ba3
build date: 20251206-13:23:49
go version: go1.25.5
platform: linux/amd64
tags: unknown
chmod +x /root/blackbox_exporter-0.28.0.linux-amd64/blackbox_exporter
blackbox_exporter --config.file ./blackbox_exporter-0.28.0.linux-amd64/blackbox.yml
cat > /etc/systemd/system/blackbox_exporter.service <<EOF
[Unit]
Description=Blackbox Exporter
After=network.target
[Service]
Type=simple
User=root
Group=root
WorkingDirectory=/root/blackbox_exporter-0.28.0.linux-amd64
ExecStart=blackbox_exporter --config.file=/root/blackbox_exporter-0.28.0.linux-amd64/blackbox.yml
Restart=always
RestartSec=10
[Install]
WantedBy=multi-user.target
EOF
systemctl daemon-reload
systemctl start blackbox_exporter.service
systemctl status blackbox_exporter
● blackbox_exporter.service - Blackbox Exporter
Loaded: loaded (/etc/systemd/system/blackbox_exporter.service; disabled; preset: disabled)
Active: active (running) since Tue 2026-07-07 17:36:42 CST; 3s ago
Main PID: 570589 (blackbox_export)
Tasks: 8 (limit: 254768)
Memory: 5.8M
CPU: 11ms
CGroup: /system.slice/blackbox_exporter.service
└─570589 /root/blackbox_exporter-0.28.0.linux-amd64/blackbox_exporter --config.file=/r>
Jul 07 17:36:42 1panel systemd[1]: Started Blackbox Exporter.
Jul 07 17:36:42 1panel blackbox_exporter[570589]: ts=2026-07-07T17:36:42.755+08:00 caller=main.go:>
Jul 07 17:36:42 1panel blackbox_exporter[570589]: ts=2026-07-07T17:36:42.755+08:00 caller=main.go:>
Jul 07 17:36:42 1panel blackbox_exporter[570589]: ts=2026-07-07T17:36:42.755+08:00 caller=main.go:>
Jul 07 17:36:42 1panel blackbox_exporter[570589]: ts=2026-07-07T17:36:42.755+08:00 caller=main.go:>
Jul 07 17:36:42 1panel blackbox_exporter[570589]: ts=2026-07-07T17:36:42.756+08:00 caller=main.go:>
Jul 07 17:36:42 1panel blackbox_exporter[570589]: ts=2026-07-07T17:36:42.760+08:00 caller=main.go:>
Jul 07 17:36:42 1panel blackbox_exporter[570589]: ts=2026-07-07T17:36:42.760+08:00 caller=main.go:>
ss -tunlp | grep 9115
tcp LISTEN 0 4096 *:9115 *:* users:(("blackbox_export",pid=570589,fd=3))
|
docker部署
1
2
3
4
5
6
|
docker run --rm \
-p 9115/tcp \
--name blackbox_exporter \
-v $(pwd):/config \
quay.io/prometheus/blackbox-exporter:latest --config.file=/config/blackbox.yml
|
helm部署
1
2
3
4
5
6
7
8
9
10
11
12
|
helm repo add prometheus-community https://prometheus-community.github.io/helm-charts
helm repo update
helm search repo | grep blackbox
prometheus-community/prometheus-blackbox-exporter 11.15.1 v0.28.0 Prometheus Blackbox Exporter
helm pull prometheus-community/prometheus-blackbox-exporter --untar
cd prometheus-blackbox-exporter/
helm upgrade --install blackbox-exporter ./ -f values.yaml -n monitoring
|
二进制部署与使用
配置文件blackbox.yml
二进制和docker以及k8s manifest部署使用:
默认自定义了14 个探测模块
1
2
3
4
5
| modules:
http_2xx:...
http_post_2xx:...
...
postgresql:...
|
| 配置项 |
层级 |
作用 |
modules.<name>.prober |
模块级 |
探测协议:http/tcp/dns/icmp/grpc |
modules.<name>.timeout |
模块级 |
超时时间,如 5s, 15s |
http.method |
http |
GET/POST |
http.valid_status_codes |
http |
期望状态码,默认 [2xx] |
http.fail_if_not_ssl |
http |
非 HTTPS 则失败 |
http.headers |
http |
自定义请求头 |
http.follow_redirects |
http |
是否跟随重定向 |
http.preferred_ip_protocol |
http |
优先 ip4 或 ip6 |
http.body_size_limit |
http |
响应体大小限制 |
http.fail_if_body_matches_regexp |
http |
body 匹配正则则失败 |
tcp.query_response |
tcp |
多步交互探测序列 |
tcp.tls |
tcp |
启用 TLS |
tls_config.insecure_skip_verify |
tls |
跳过证书校验 |
icmp.ttl |
icmp |
限制 TTL 值 |
grpc.tls |
grpc |
gRPC TLS 开关 |
grpc.service |
grpc |
gRPC 服务名 |
对接prometheus
修改kube-prometheus-stack配置
由于二进制的版本并非部署在k8s集群中,所以无法对集群内部使用clusterIP的服务进行监控
1
2
3
4
5
6
7
8
9
10
11
12
13
14
15
16
17
18
19
20
21
22
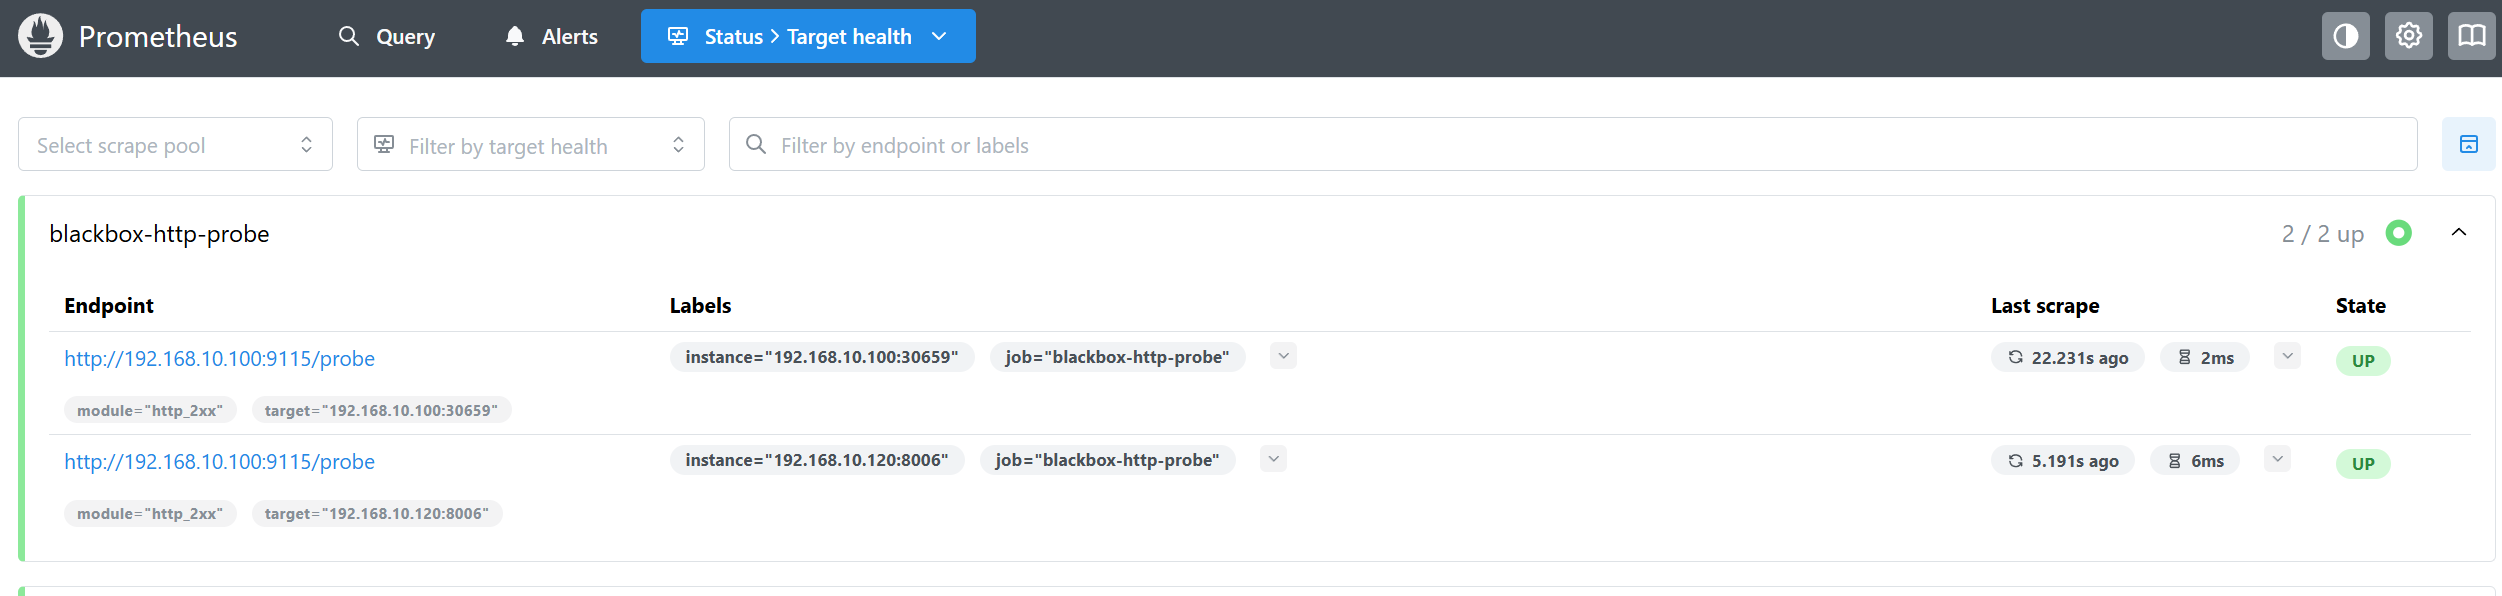
| cd kube-prometheus-stack
vim values.yaml
...
additionalScrapeConfigs:
...
- job_name: 'blackbox-http-probe'
metrics_path: /probe
params:
module: [http_2xx]
static_configs:
- targets:
- 192.168.10.100:30659
- 192.168.10.120:8006
relabel_configs:
- source_labels: [__address__]
target_label: __param_target
- source_labels: [__param_target]
target_label: instance
- target_label: __address__
replacement: 192.168.10.100:9115
helm upgrade prometheus . -n prometheus -f values.yaml
|
K8s部署与使用
配置文件values.yaml(如果使用Helm)
基本和blackbox.yml没有区别,在config.modules中直接配置相关的模块,并且支持在secret中保存
但是说实话感觉没啥意思,因为这个组件本身很简单,用helm的方式就非常复杂,除非要做helm做整合
1
2
3
4
5
6
7
8
9
10
| secretConfig: false
config:
modules:
http_2xx:
prober: http
timeout: 5s
http:
valid_http_versions: ["HTTP/1.1", "HTTP/2.0"]
follow_redirects: true
preferred_ip_protocol: "ip4"
|
使用manifests资源清单部署
1
2
3
4
5
6
7
8
9
10
11
12
13
14
15
16
17
18
19
20
21
22
23
24
25
26
27
28
29
30
31
32
33
34
35
36
37
38
39
40
41
42
43
44
45
46
47
48
49
50
51
52
53
54
55
56
57
58
59
60
61
62
63
64
65
66
67
68
69
70
71
72
73
74
75
76
77
78
79
80
81
82
83
84
85
86
87
88
89
90
91
92
93
94
95
96
97
98
99
100
101
102
| apiVersion: apps/v1
kind: Deployment
metadata:
name: blackbox-exporter
namespace: monitoring
labels:
app: blackbox-exporter
spec:
replicas: 1
selector:
matchLabels:
app: blackbox-exporter
template:
metadata:
labels:
app: blackbox-exporter
spec:
containers:
- name: blackbox-exporter
image: prom/blackbox-exporter:v0.28.0
args:
- "--config.file=/config/blackbox.yml"
ports:
- containerPort: 9115
name: http
volumeMounts:
- name: config
mountPath: /config
securityContext:
capabilities:
add: ["NET_RAW"]
resources:
requests:
cpu: 50m
memory: 64Mi
limits:
cpu: 200m
memory: 128Mi
volumes:
- name: config
configMap:
name: blackbox-exporter-config
---
apiVersion: v1
kind: Service
metadata:
name: blackbox-exporter
namespace: monitoring
labels:
app: blackbox-exporter
spec:
type: ClusterIP
ports:
- port: 9115
targetPort: http
protocol: TCP
name: http
selector:
app: blackbox-exporter
---
apiVersion: v1
kind: ConfigMap
metadata:
name: blackbox-exporter-config
namespace: monitoring
data:
blackbox.yml: |
modules:
http_2xx:
prober: http
timeout: 10s
http:
preferred_ip_protocol: "ip4"
valid_http_versions: ["HTTP/1.1", "HTTP/2.0"]
follow_redirects: true
fail_if_ssl: false
fail_if_not_ssl: false
http_post_2xx:
prober: http
http:
method: POST
tcp_connect:
prober: tcp
timeout: 5s
icmp:
prober: icmp
timeout: 5s
dns_resolve:
prober: dns
dns:
query_name: "example.com"
query_type: "A"
kubectl apply -f .
kubectl get pods -n monitoring
NAME READY STATUS RESTARTS AGE
blackbox-exporter-87cd576cf-84stq 1/1 Running 0 23h
kubectl get svc -n monitoring
NAME TYPE CLUSTER-IP EXTERNAL-IP PORT(S) AGE
blackbox-exporter ClusterIP 10.96.192.58 <none> 9115/TCP 24h
|
K8s部署对接prometheus的四种方式
1
2
3
4
5
6
7
8
9
10
11
12
13
14
15
16
17
18
19
20
21
22
23
24
25
26
27
28
29
30
31
32
33
34
35
36
37
38
39
40
41
42
43
44
45
46
47
48
49
50
51
52
53
54
55
56
57
58
59
| 有四种方式
1.ServiceMonitor/PodMonitor(Prometheus Operator提供的CRD)
自动发现集群内Service/Pod并生成scrape配置
但是不适合Blackbox Exporter,因为Blackbox Exporter需要target进行传参
不支持这种模式
2.additionalScrapeConfigs(Helm values.yaml)
在kube-prometheus-stack的Helm values.yaml变量文件
直接写additionalScrapeConfigs,渲染后注入到 prometheus.yml
additionalScrapeConfigs:
- job_name: 'blackbox-http'
metrics_path: /probe
params:
module: [http_2xx]
static_configs:
- targets: ['192.168.10.100:30659']
relabel_configs:
- source_labels: [__address__]
target_label: __param_target
- source_labels: [__param_target]
target_label: instance
- target_label: __address__
replacement: 172.19.0.1:9115
3.ScrapeConfig CRD(Prometheus Operator 提供)
声明式CRD
apiVersion: monitoring.coreos.com/v1alpha1
kind: ScrapeConfig
metadata:
name: blackbox-http-probe
namespace: monitor
spec:
metricsPath: /probe
params:
module: [http_2xx]
staticConfigs:
- targets: ['192.168.10.100:30659']
relabelConfigs:
- sourceLabels: [__address__]
targetLabel: __param_target
- sourceLabels: [__param_target]
targetLabel: instance
- targetLabel: __address__
replacement: 172.19.0.1:9115
4.静态配置 ConfigMap(直接部署Prometheus)
一般比较少用,适用于比较传统的部署prometheus的方式
scrape_configs:
- job_name: 'blackbox-http'
metrics_path: /probe
static_configs:
- targets: ['192.168.10.100:30659']
relabel_configs: ...
|
使用scrapeconfig CRD对接
helm直接已经操练过了,就不用了,这次用这种方式,以前没用过
1
2
3
4
5
6
7
8
9
10
11
12
13
14
15
16
17
18
19
20
21
22
23
24
25
26
27
28
29
30
31
32
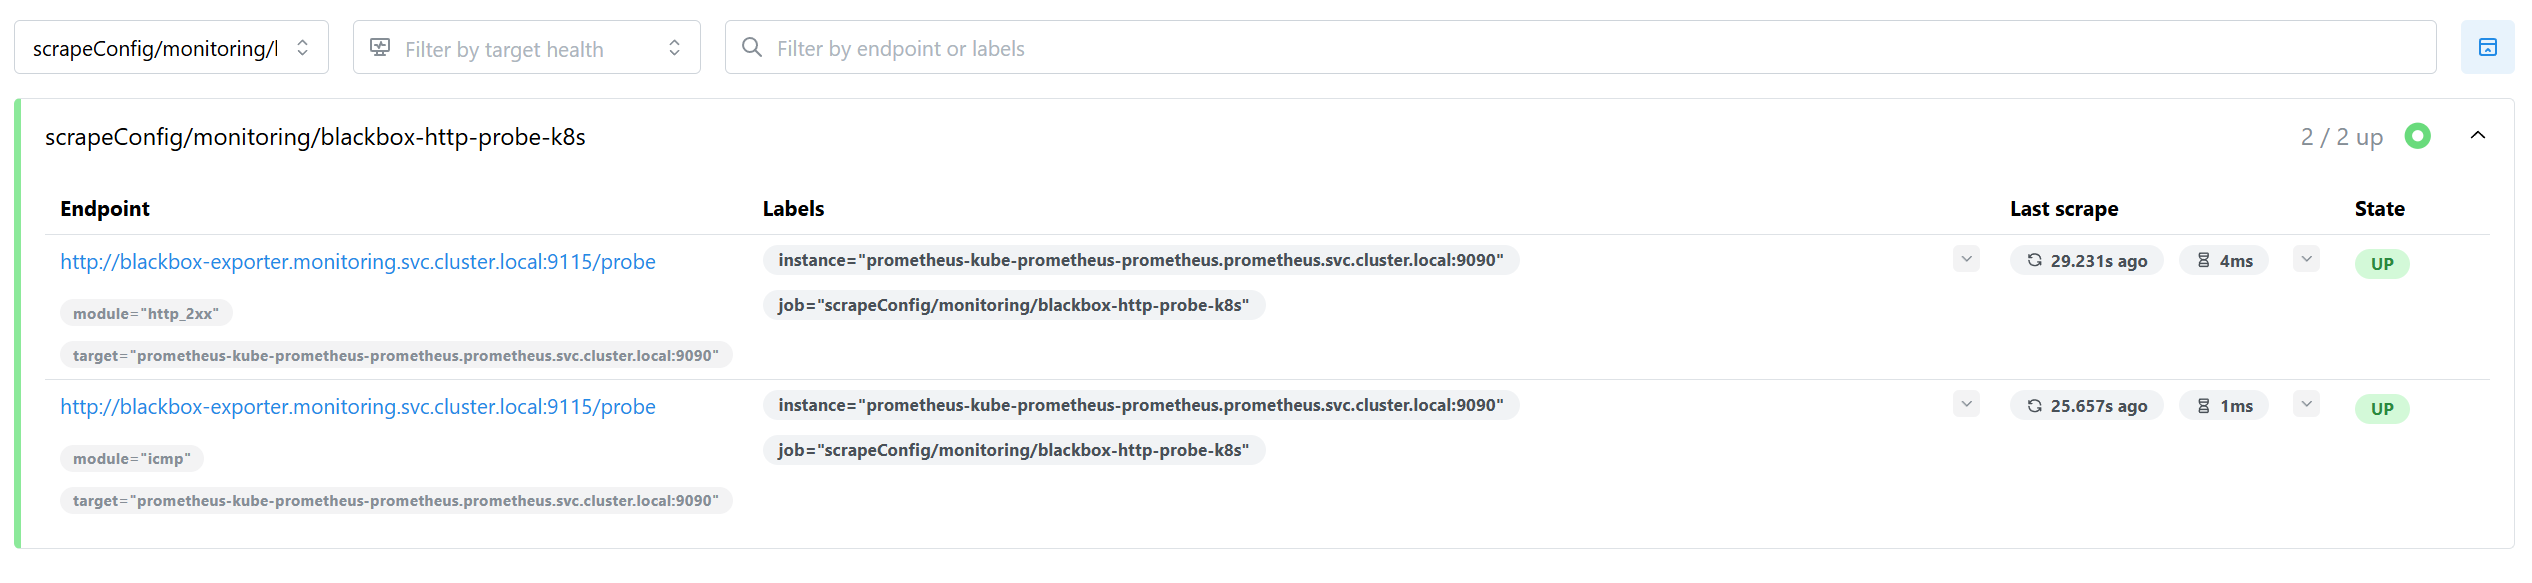
| apiVersion: monitoring.coreos.com/v1alpha1
kind: ScrapeConfig
metadata:
name: blackbox-http-probe-k8s
namespace: monitoring
labels:
release: prometheus
spec:
metricsPath: /probe
staticConfigs:
- labels:
__param_module: http_2xx
targets:
- prometheus-kube-prometheus-prometheus.prometheus.svc.cluster.local:9090
- labels:
__param_module: icmp
targets:
- prometheus-kube-prometheus-prometheus.prometheus.svc.cluster.local:9090
relabelings:
- sourceLabels: [__address__]
targetLabel: __param_target
- sourceLabels: [__param_target]
targetLabel: instance
- targetLabel: __address__
replacement: blackbox-exporter.monitoring.svc.cluster.local:9115
kubectl apply -f scrapeconfig.yaml
kubectl get scfg -n monitoring
NAME AGE
blackbox-http-probe-k8s 11s
|