基础概念 APISIX 在 K8s 中分两个面:
数据面(Data Plane)
控制面(Control Plane)
用途
处理用户流量,路由+插件+转发
管理路由/插件/证书配置
端口
80/443
9180(Admin API)
谁访问
外部用户
Ingress Controller
部署方式
DaemonSet + hostNetwork
Deployment
1
2
3
4
5
6
7
8
9
10
11
12
13
K8s Ingress /APISIXRoute 资源 │ ▼ Ingress Controller (翻译官,Deployment ) │ GatewayProxy CRD ▼ APISIX Admin API (:9180 )(控制面) │ etcd watch ▼ APISIX Data Plane (数据面,DaemonSet + hostNetwork) │ ▼ 后端服务
Ingress Controller :Deployment,1个副本,把 K8s 资源翻译成 Admin API 调用
APISIX 数据面 :DaemonSet,多副本,hostNetwork 直连宿主机网卡,处理实际流量
GatewayProxy :不是外部入口,是 Ingress Controller → Admin API 的”电话本”
etcd :配置中心,数据面通过 watch 实时同步配置
如果使用k8s service,流量不可控,所以做成daemonset+hostNetwork的形态,并且可以做VIP主备,引导与控制各节点流量
环境说明 1 2 3 4 5 6 7 8 10.163.2.145 ansible 10.163.2.106 master1 10.163.2.102 master2 10.163.2.101 master3 10.163.2.109 worker1 10.163.2.108 worker2 10.163.2.131 worker3 共用管理网段与业务网段
apisix-ingress-controller部署与values参数(如果直接使用apisix的chart一体化安装,就不需要这一步) 参考文档:https://apisix.apache.org/zh/docs/helm-chart/apisix/
如果只安装apisix,就需要像docker部署apisix一样,通过api的方式进行访问,甚至更加麻烦,要k8s打一个port-forward出来
需要安装apisix-ingress-controller,让k8s可以使用CRD对apisix进行管理
1 2 3 4 5 6 7 8 9 10 11 12 13 14 15 16 17 18 19 20 21 22 23 24 25 26 27 28 29 30 31 32 33 34 35 36 37 38 39 40 41 42 43 44 45 46 47 48 49 50 51 52 53 54 55 56 57 58 59 60 61 helm repo add apisix https://apache.github.io/apisix-helm-chart helm repo update helm search repo NAME CHART VERSION APP VERSION DESCRIPTION apisix/apisix 2.17.0 3.18.0 A Helm chart for Apache APISIX v3 apisix/apisix-dashboard 0.8.3 3.0.0 DEPRECATED A Helm chart for Apache APISIX Dashb... apisix/apisix-ingress-controller 1.3.0 2.2.0 Apache APISIX Ingress Controller for Kubernetes helm pull apisix/apisix-ingress-controller --untar (1)GatewayProxy 连接配置 gatewayProxy: createDefault: false provider: type : ControlPlane controlPlane: endpoints: [] service: name: "" port: 9180 auth: type : AdminKey adminKey: value: "edd1c9f034335f136f87ad84b625c8f1" valueFrom: {} plugins: [] pluginMetadata: {} (2)apisix.adminService 连接配置(兜底),不建议使用 apisix: adminService: namespace: apisix-ingress name: apisix-admin port: 9180 (3)config.kubernetes(K8s 资源匹配) config: kubernetes: ingressClass: apisix defaultIngressClass: false 修改连接配置 gatewayProxy: createDefault: true provider: type : ControlPlane controlPlane: endpoints: [] service: name: "apisix-admin" port: 9180 helm upgrade --install apisix-ingress-controller ./ -f values.yaml -n apisix --create-namespace Release "apisix-ingress-controller" does not exist. Installing it now. NAME: apisix-ingress-controller LAST DEPLOYED: Wed Sep 2 10:06:19 2026 NAMESPACE: apisix STATUS: deployed REVISION: 1 TEST SUITE: None
apisix部署与values参数(一体安装) 这种安装模式下,不需要单独的ingress-contrllor的chart部署
参考文档:https://apisix.apache.org/docs/ingress-controller/getting-started/get-apisix-ingress-controller/
1 2 3 4 5 6 7 8 9 10 11 12 13 14 15 16 17 18 19 20 21 22 23 24 25 26 27 28 29 30 31 32 33 34 35 36 37 38 39 40 41 42 43 44 45 46 47 48 49 50 51 52 53 54 55 56 57 58 59 60 61 62 63 64 65 helm pull apisix/apisix --version 2.14.1 --untar 1.部署模式 useDaemonSet: true replicaCount: 1 hostNetwork: true 2.etcd部署模式 etcd: enabled: true replicaCount: 3 persistence: storageClass: "openebs-hostpath" size: 8Gi 3.Admin API(控制面) apisix: admin: enabled: true port: 9180 credentials: admin: edd1c9f034335f136f87ad84b625c8f1 viewer: 4054f7cf07e344346cd3f287985e76a2 allow: ipList: - 10.163.2.0/24 - 10.233.0.0/16 4.ingress-controller的模式配置 ingress-controller: enabled: true webhook: enabled: false config: provider: type : apisix apisix: adminService: namespace: apisix gatewayProxy: createDefault: true helm upgrade --install apisix ./ -f values.yaml -n apisix Release "apisix" does not exist. Installing it now. Error: failed to install CRD crds/gwapi-crds.yaml: [resource mapping not found for name: "safe-upgrades.gateway.networking.k8s.io" namespace: "" from "" : no matches for kind "ValidatingAdmissionPolicy" in version "admissionregistration.k8s.io/v1" ensure CRDs are installed first, resource mapping not found for name: "safe-upgrades.gateway.networking.k8s.io" namespace: "" from "" : no matches for kind "ValidatingAdmissionPolicyBinding" in version "admissionregistration.k8s.io/v1" ensure CRDs are installed first] helm upgrade --install apisix ./ -f values.yaml -n apisix kubectl get pods -n apisix NAME READY STATUS RESTARTS AGE apisix-dvm69 1/1 Running 0 23h apisix-etcd-0 1/1 Running 1 (23h ago) 23h apisix-etcd-1 1/1 Running 0 23h apisix-etcd-2 1/1 Running 3 (23h ago) 23h apisix-gxhwz 1/1 Running 0 23h apisix-hghcp 1/1 Running 0 23h apisix-ingress-controller-96d76d68f-5scpv 2/2 Running 0 24h apisix-km58d 1/1 Running 0 23h apisix-svbkz 1/1 Running 0 23h apisix-z7vkt 1/1 Running 0 23h
ApisixRoute基础路由 + 后端服务部署 1 2 3 4 5 6 7 8 9 10 11 12 13 14 15 16 17 18 19 20 21 22 23 24 25 26 27 28 29 30 31 32 33 34 35 36 37 38 39 40 41 42 43 44 45 46 47 48 49 50 51 52 53 54 55 56 57 58 59 60 61 62 63 64 65 66 67 68 69 70 71 72 73 74 75 76 77 78 79 80 1.测试用 nginx deployment + service 用途:验证 ApisixRoute 路由功能 apiVersion: apps/v1 kind: Deployment metadata: name: nginx-test labels: app: nginx-test spec: replicas: 2 selector: matchLabels: app: nginx-test template: metadata: labels: app: nginx-test spec: containers: - name: nginx image: nginx:1.25 ports: - containerPort: 80 resources: requests: cpu: 100m memory: 64Mi limits: cpu: 200m memory: 128Mi --- apiVersion: v1 kind: Service metadata: name: nginx-test labels: app: nginx-test spec: selector: app: nginx-test ports: - port: 80 targetPort: 80 protocol: TCP kubectl apply -f nginx-test.yaml kubectl get pods NAME READY STATUS RESTARTS AGE nginx-test-6ccd4d8b7b-jrdb8 1/1 Running 0 8m52s nginx-test-6ccd4d8b7b-jsj5t 1/1 Running 0 8m52s 2.创建基础 ApisixRoute(必须加 ingressClassName) apiVersion: apisix.apache.org/v2 kind: ApisixRoute metadata: name: nginx-test-route namespace: default spec: ingressClassName: apisix http: - name: test-route match: paths: - "/" backends: - serviceName: nginx-test servicePort: 80 kubectl apply -f apisixroute-basic.yaml kubectl get ar NAME HOSTS URIS AGE nginx-test-route ["/" ] 26h curl http://10.163.2.106:30702/ ... <p><em>Thank you for using nginx.</em></p> ...
插件-限流、重写 限流插件是针对单个apisix的pod进行的,所以实际进行压测的时候实际要乘以pod数量
插件
限什么
场景
limit-req
每秒 QPS
漏桶平滑
limit-count
总次数/窗口
固定窗口
limit-conn
同时在线连接数
并发连接
QPS限流——limit-req(带重写) 1 2 3 4 5 6 7 8 9 10 11 12 13 14 15 16 17 18 19 20 21 22 23 24 25 26 27 28 29 30 31 32 33 34 35 36 37 38 39 40 41 42 43 44 45 46 47 48 apiVersion: apisix.apache.org/v2 kind: ApisixRoute metadata: name: nginx-test-route namespace: default spec: ingressClassName: apisix http: - name: rate-limit-route match: paths: - "/test" plugins: - name: proxy-rewrite enable : true config: regex_uri: ["^/test(/.*)?$" , "$1 " ] - name: limit-req enable : true config: rate: 2 burst: 1 rejected_code: 429 key: remote_addr key_type: var rejected_msg: "请求太频繁" delay: 0 nodelay: false backends: - serviceName: nginx-test servicePort: 80 kubectl apply -f apisixroute-limit-req.yaml wrk -t10 -c10 -d3s http://10.163.2.106:30702/test Running 3s test @ http://10.163.2.106:30702/test 10 threads and 10 connections Thread Stats Avg Stdev Max +/- Stdev Latency 94.46ms 150.04ms 508.86ms 80.87% Req/Sec 498.79 314.21 1.10k 62.67% 8292 requests in 3.10s, 1.84MB read Non-2xx or 3xx responses: 8250 Requests/sec: 2675.35 Transfer/sec: 609.36KB 可见总请求8292 2xx和3xx有8250个请求
固定窗口计数(适合API)——limit-count 1 2 3 4 5 6 7 8 9 10 11 12 13 14 15 16 17 18 19 20 21 22 23 24 25 26 27 28 29 30 31 32 33 34 35 36 37 38 39 40 apiVersion: apisix.apache.org/v2 kind: ApisixRoute metadata: name: nginx-test-route namespace: default spec: ingressClassName: apisix http: - name: rate-limit-route match: paths: - "/" plugins: - name: limit-count enable : true config: count: 10 time_window: 60 key: remote_addr rejected_code: 429 rejected_msg: "API 请求超限,请稍后再试" policy: local backends: - serviceName: nginx-test servicePort: 80 wrk -t5 -c50 -d3s http://10.163.2.106:30702/ Running 3s test @ http://10.163.2.106:30702/ 5 threads and 50 connections Thread Stats Avg Stdev Max +/- Stdev Latency 5.75ms 2.91ms 40.83ms 75.56% Req/Sec 1.77k 227.64 2.49k 66.00% 26408 requests in 3.01s, 8.12MB read Non-2xx or 3xx responses: 26348 Requests/sec: 8769.97 Transfer/sec: 2.70MB 26408-26348=60 有60个请求通过了,是因为我们pod数有6个,一共可以通过60个
并发连接限制——limit-conn 1 2 3 4 5 6 7 8 9 10 11 12 13 14 15 16 17 18 19 20 21 22 23 24 25 26 27 28 29 30 31 32 33 34 35 36 37 apiVersion: apisix.apache.org/v2 kind: ApisixRoute metadata: name: nginx-test-route namespace: default spec: ingressClassName: apisix http: - name: rate-limit-route match: paths: - "/" plugins: - name: limit-conn enable : true config: conn: 2 burst: 1 default_conn_delay: 0.1 rejected_code: 429 rejected_msg: "并发连接超限" key: remote_addr backends: - serviceName: nginx-test servicePort: 80 wrk -t10 -c20 -d3s http://10.163.2.106:30702/ Running 3s test @ http://10.163.2.106:30702/ 10 threads and 20 connections Thread Stats Avg Stdev Max +/- Stdev Latency 28.15ms 34.58ms 108.89ms 78.78% Req/Sec 207.84 321.99 1.62k 82.33% 6216 requests in 3.10s, 1.78MB read Non-2xx or 3xx responses: 5562 Requests/sec: 2005.41 Transfer/sec: 587.36KB
key的类型(按什么进行限流
key 值
说明
场景
remote_addr
客户端 IP
最常用,每 IP 独立计数
http_x_forwarded_for
真实 IP(经过代理/LB)
有 Nginx/LB 在前面时用
http_user_agent
User-Agent
按浏览器/客户端类型限流
http_referer
Referer
按来源页面限流
server_addr
服务端 IP
多入口场景
consumer_name
认证用户
配合 key-auth,按用户限流
route_id
路由 ID
按路由限流
插件-traffic-split分流(金丝雀发布),并且对比istio 这个插件不需要显式加载,直接在ar后面加入weight字段即可,并且使用service作为访问端点
1 2 3 4 5 6 7 8 9 10 11 12 13 14 15 16 17 18 19 20 21 22 23 24 25 26 27 28 29 30 31 32 33 34 35 36 37 38 39 40 41 42 43 44 45 46 47 48 49 50 51 52 53 54 55 56 57 58 59 60 61 62 63 64 65 66 67 68 69 70 71 72 73 74 75 76 apiVersion: apps/v1 kind: Deployment metadata: name: nginx-v2 spec: replicas: 2 selector: matchLabels: app: nginx-v2 template: metadata: labels: app: nginx-v2 spec: containers: - name: nginx image: nginx:1.25 ports: - containerPort: 80 command : ["/bin/sh" , "-c" ] args: - echo '<h1 style="color:red">Hello from v2!</h1>' > /usr/share/nginx/html/index.html && nginx -g "daemon off;" --- apiVersion: v1 kind: Service metadata: name: nginx-v2 spec: selector: app: nginx-v2 ports: - port: 80 targetPort: 80 kubectl get svc NAME TYPE CLUSTER-IP EXTERNAL-IP PORT(S) AGE kubernetes ClusterIP 10.233.0.1 <none> 443/TCP 24d nginx-test ClusterIP 10.233.33.198 <none> 80/TCP 11d nginx-v2 ClusterIP 10.233.32.70 <none> 80/TCP 42s apiVersion: apisix.apache.org/v2 kind: ApisixRoute metadata: name: nginx-test-route namespace: default spec: ingressClassName: apisix http: - name: canary-route match: paths: - "/" backends: - serviceName: nginx-test servicePort: 80 weight: 90 - serviceName: nginx-v2 servicePort: 80 weight: 10 kubectl apply -f apisixroute-traffic.yaml for i in $(seq 1 100); do curl -s http://10.163.2.106:30702/ | grep -q "Hello from v2" && echo "v2" || echo "v1" done | sort | uniq -c 90 v1 10 v2
如果是istio进行分流发布 需要走三步,首先定义入口,然后通过标签对pod进行分类分成子类,再创建VirtualService来定义流量比例
对比项
APISIX
Istio
资源数量
1 个 ApisixRoute
3 个(Gateway + DestinationRule + VirtualService)
流量配置
weight 直接写 backends
weight 在 VirtualService 的 subsets 里
子集定义
不需要,直接用 Service 名
需要 DestinationRule 定义 subsets + 标签匹配
前置条件
无
需要 Sidecar 注入
1
2
3
4
5
6
7
8
9
10
11
12
13
14
15
16
17
18
19
20
21
22
23
24
25
26
27
28
29
30
31
32
33
34
35
36
37
38
39
40
41
42
43
44
45
46
47
48
apiVersion: networking.istio.io/v1beta1 kind: Gateway metadata: name: canary-gateway spec: selector: istio: ingressgateway servers: - port: number: 80 name: http protocol: HTTP hosts: ["*" ] apiVersion: networking.istio.io/v1beta1 kind: DestinationRule metadata: name: canary spec: host: canary.default.svc.cluster.local subsets: - name: v1 labels: app: v1 - name: v2 labels: app: v2 apiVersion: networking.istio.io/v1beta1 kind: VirtualService metadata: name: canary spec: hosts: ["*" ] gateways: [canary-gateway] http: - route: - destination: host: canary.default.svc.cluster.local subset: v1 weight: 90 - destination: host: canary.default.svc.cluster.local subset: v2 weight: 10
插件-prometheus监控集成 修改chart,打开apisix的metrics开关 1 2 3 4 5 6 7 8 9 10 11 12 13 14 15 16 17 18 19 20 prometheus: enabled: true path: /apisix/prometheus/metrics metricPrefix: apisix_ containerPort: 9091 helm upgrade --install apisix ./ -f values.yaml -n apisix 此时查看接口已经可以看到对应指标了 curl -s http://10.163.2.106:9091/apisix/prometheus/metrics 并且会创建对应的service kubectl get svc -n apisix ... apisix-prometheus-metrics ClusterIP 10.233.52.200 <none> 9091/TCP 6h40m
启用apisix的prometheus插件,全局规则(所有路由自动生效) 1 2 3 4 5 6 7 8 9 10 11 12 13 14 15 16 17 apiVersion: apisix.apache.org/v2 kind: ApisixGlobalRule metadata: name: prometheus-global namespace: apisix spec: ingressClassName: apisix plugins: - name: prometheus enable : true config: prefer_name: true kubectl apply -f apisixglobalrule.yaml 测试指标是否生成 wrk -t5 -c20 -d5s http://10.163.2.106:30702/ curl -s http://10.163.2.106:9091/apisix/prometheus/metrics | grep "route"
添加prometheus监控 如果是同个集群下,可以使用kube-prometheus-stack的service monitor
我现在因为不是同个集群下,所以直接用静态抓取的配置了
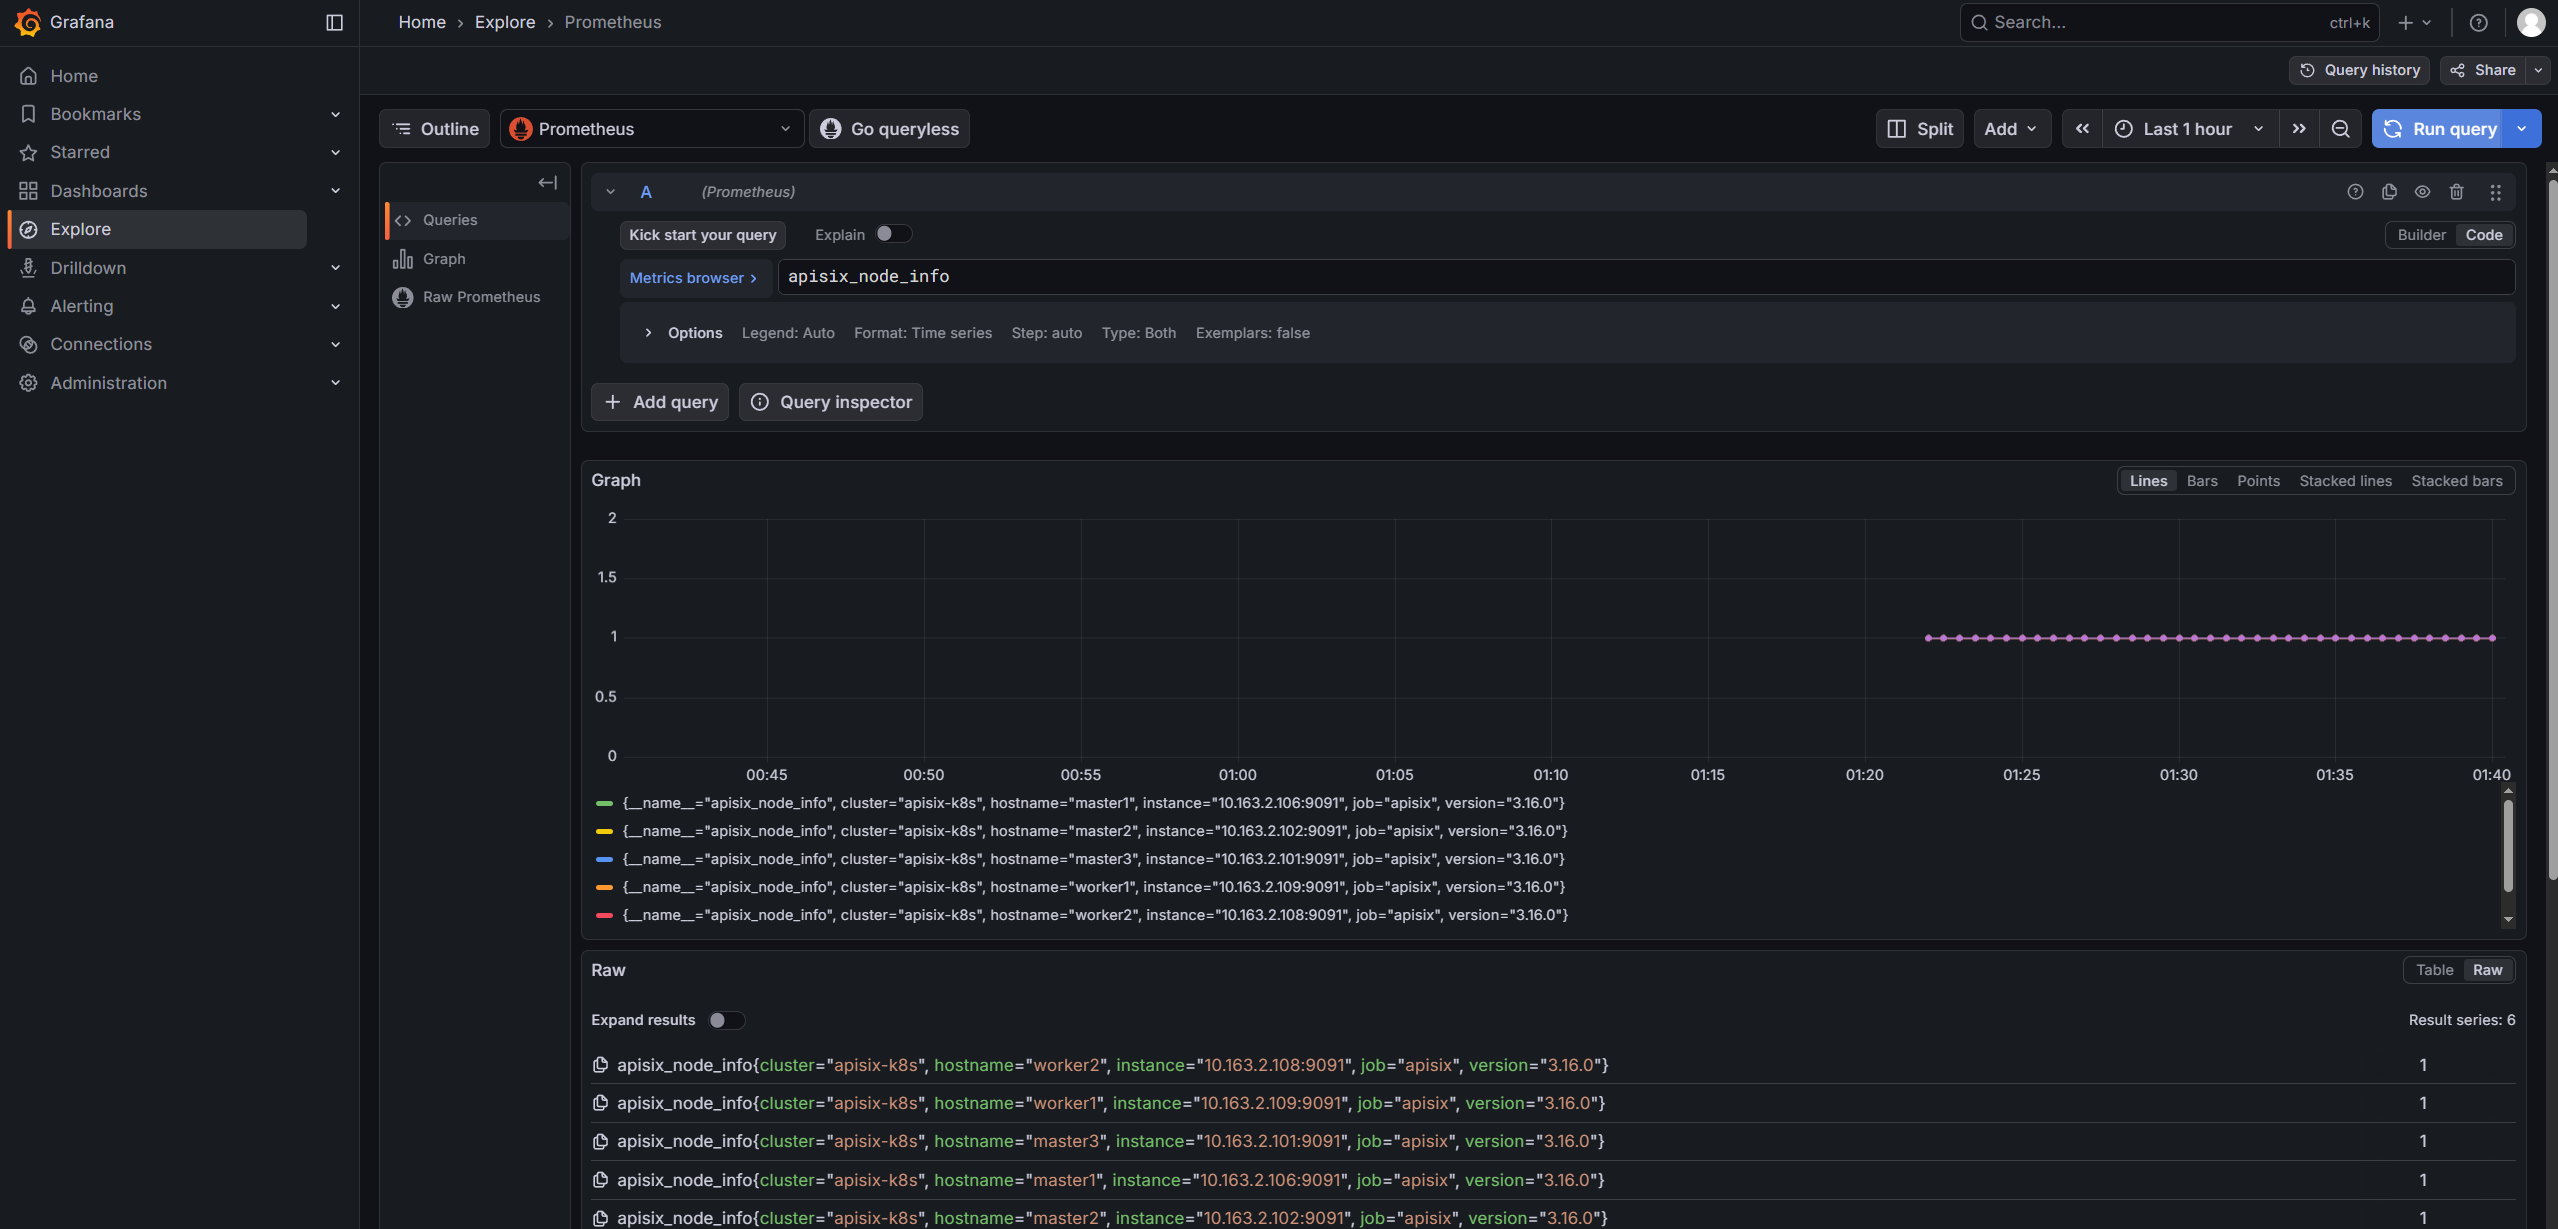
1 2 3 4 5 6 7 8 9 10 11 12 13 14 15 16 17 18 19 additionalScrapeConfigs: - job_name: 'apisix' metrics_path: /apisix/prometheus/metrics scheme: http scrape_interval: 15s scrape_timeout: 10s static_configs: - targets: - '10.163.2.101:9091' - '10.163.2.102:9091' - '10.163.2.106:9091' - '10.163.2.108:9091' - '10.163.2.109:9091' - '10.163.2.131:9091' labels: cluster: apisix-k8s helm upgrade prometheus . -n prometheus -f values.yaml kubectl port-forward -n prometheus svc/prometheus-grafana 3000:80 --address 0.0.0.0 &
快速查阅指标看下是否存在
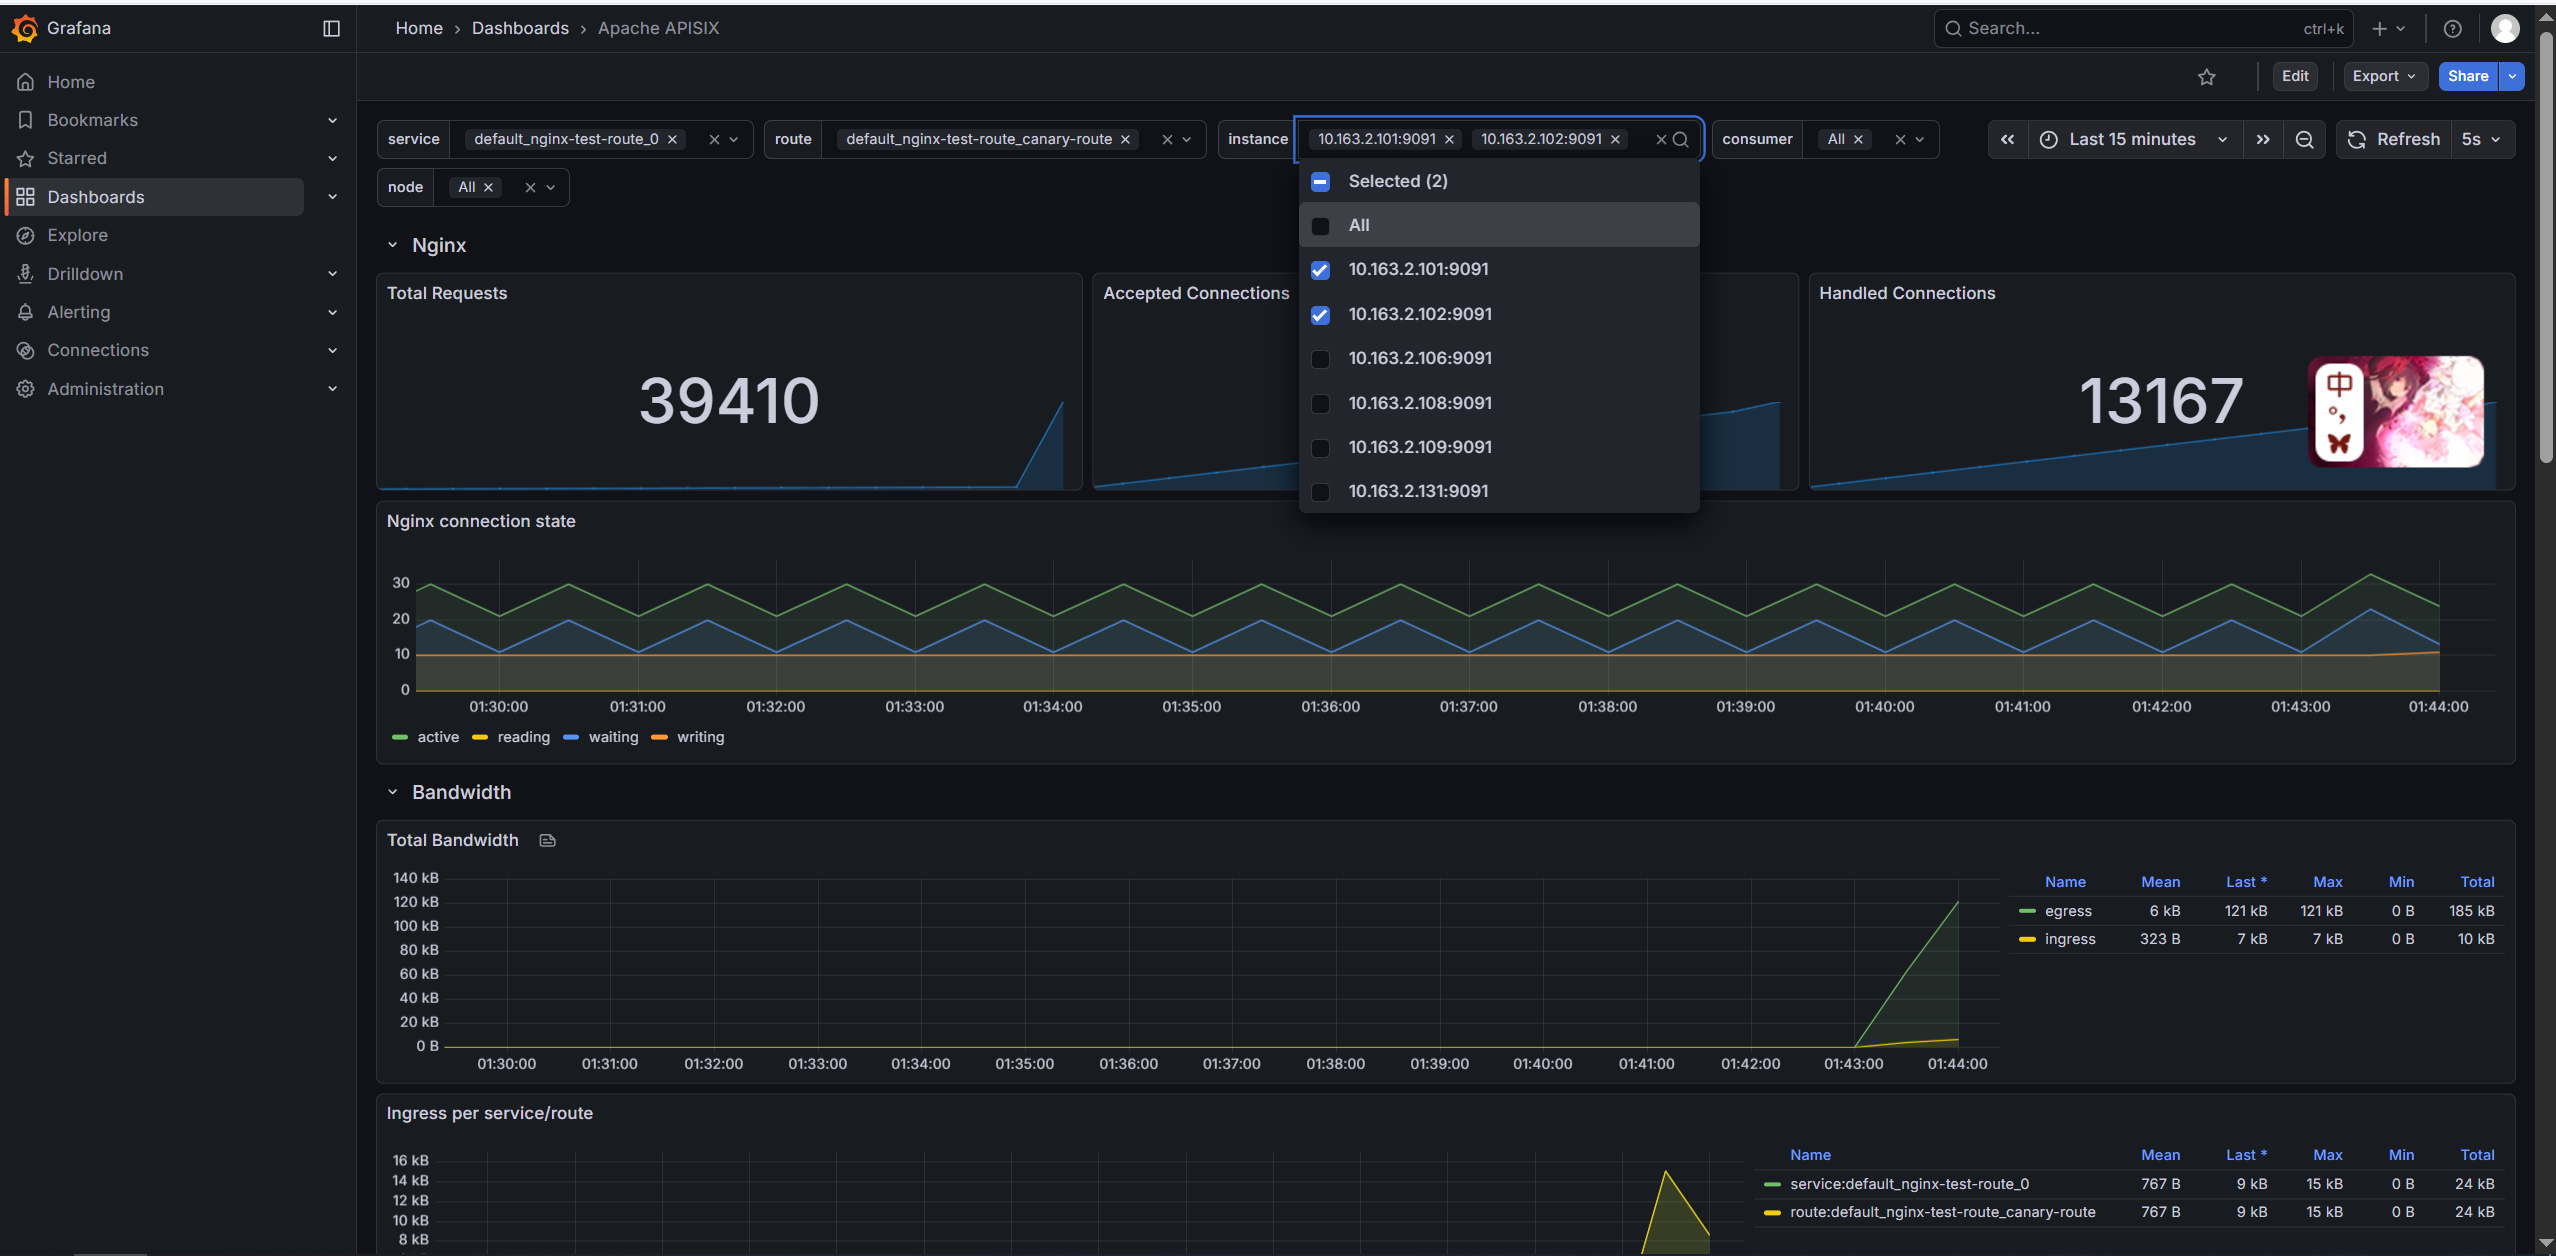
导入一个现成的仪表盘,我这里使用的是11719 ,我看我们公司用的应该也是这个