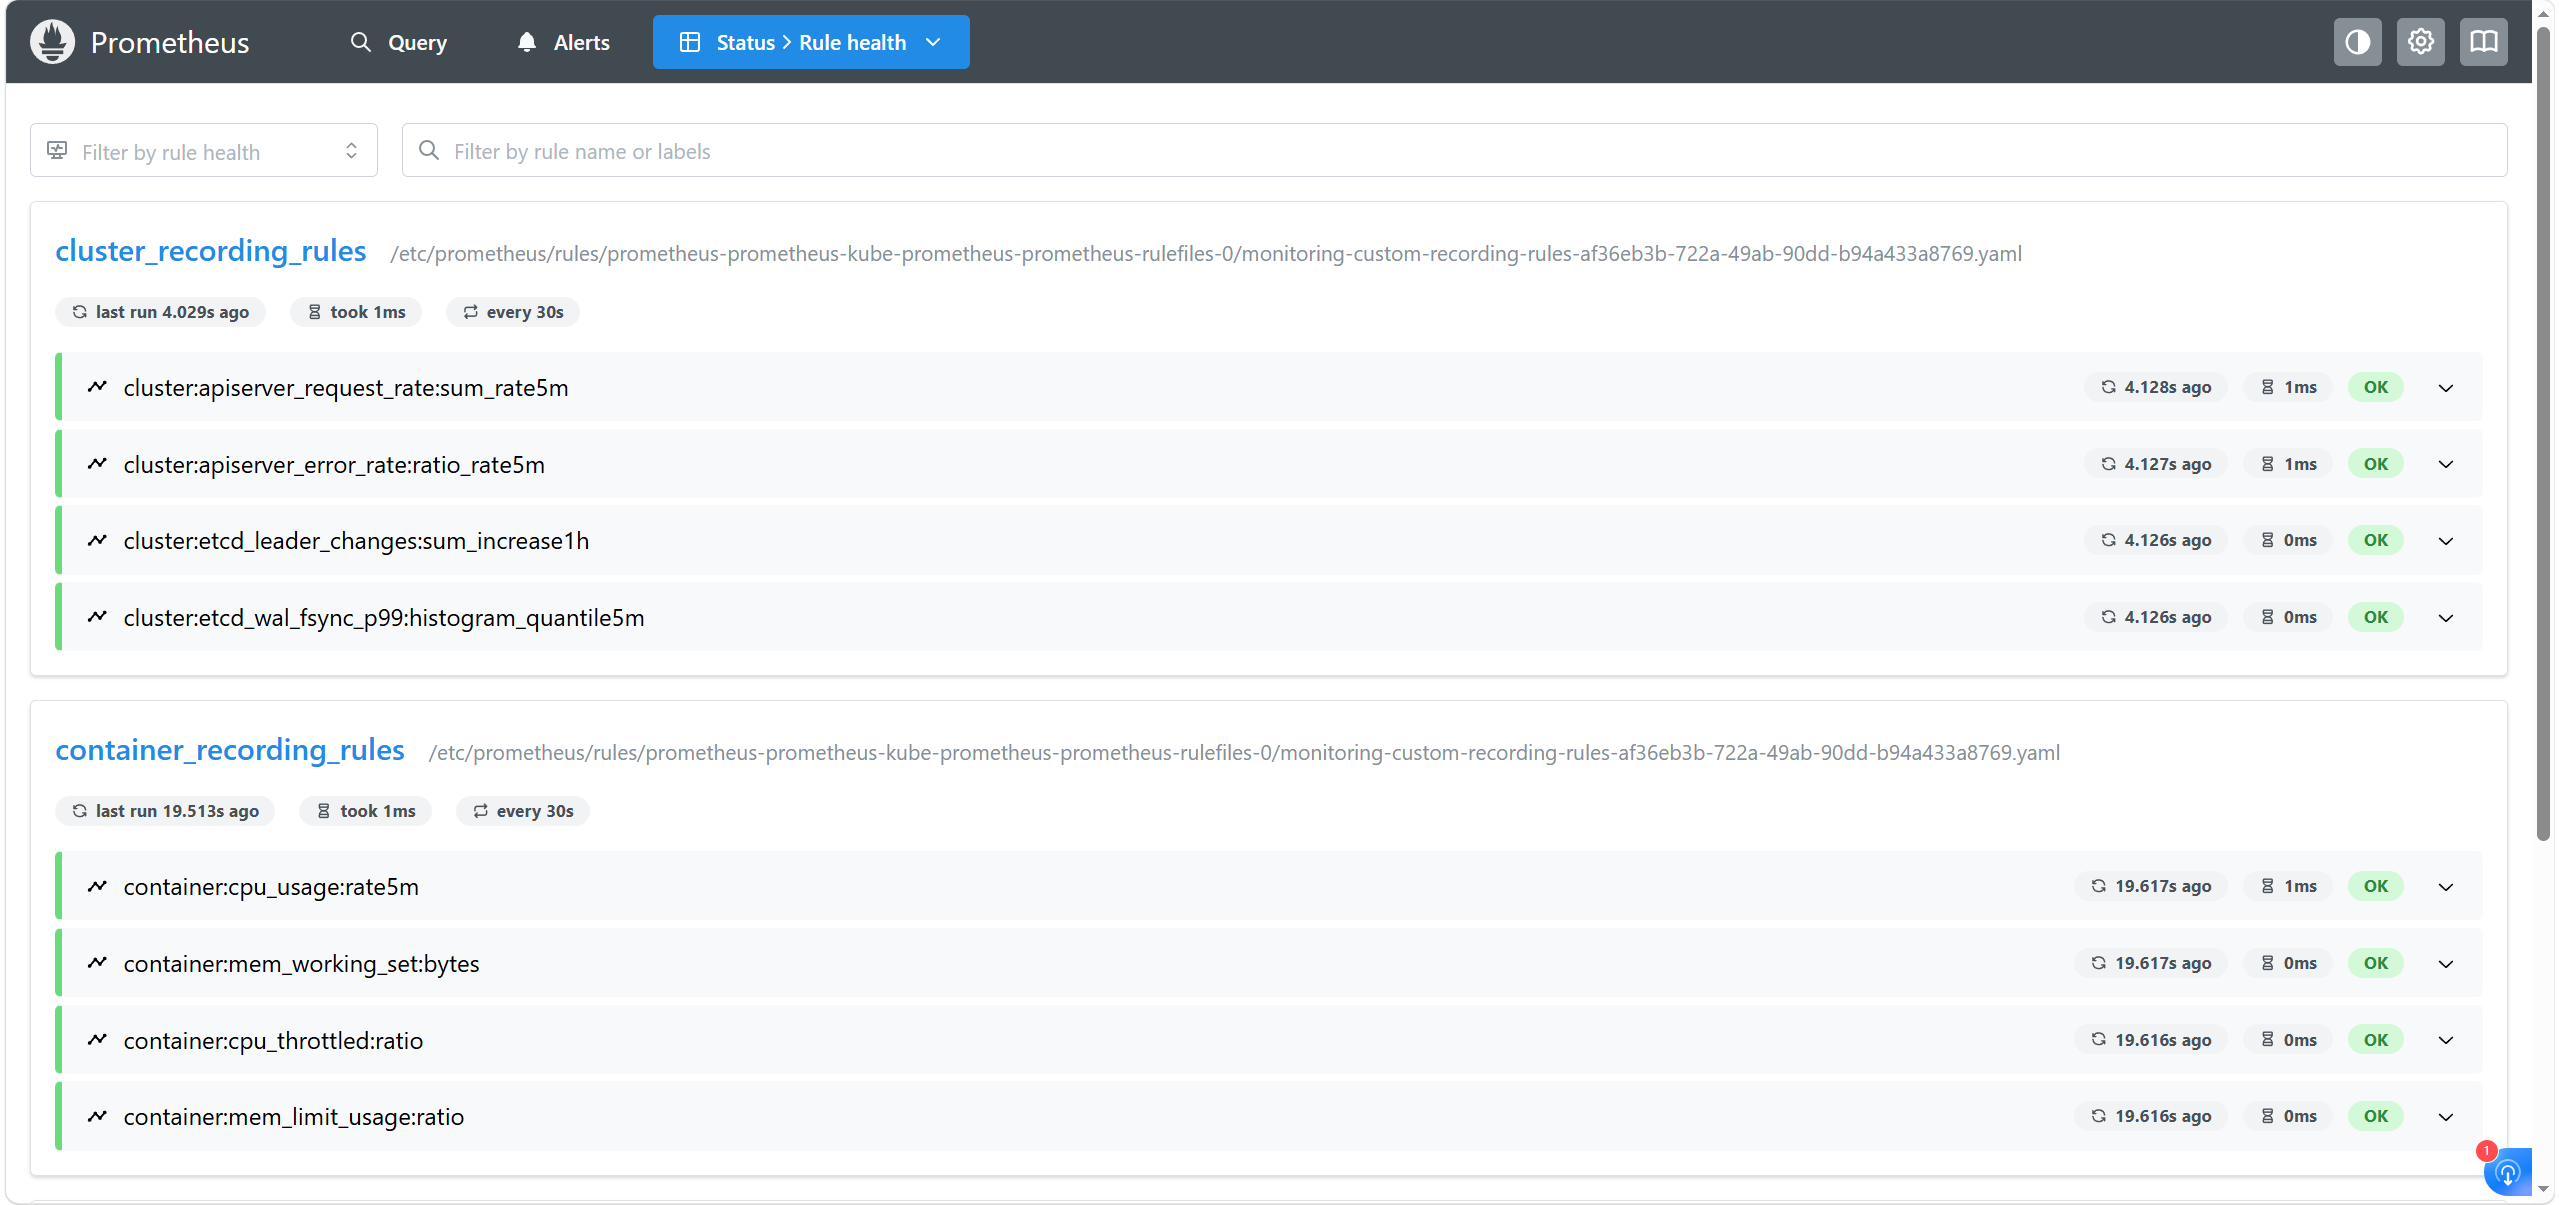
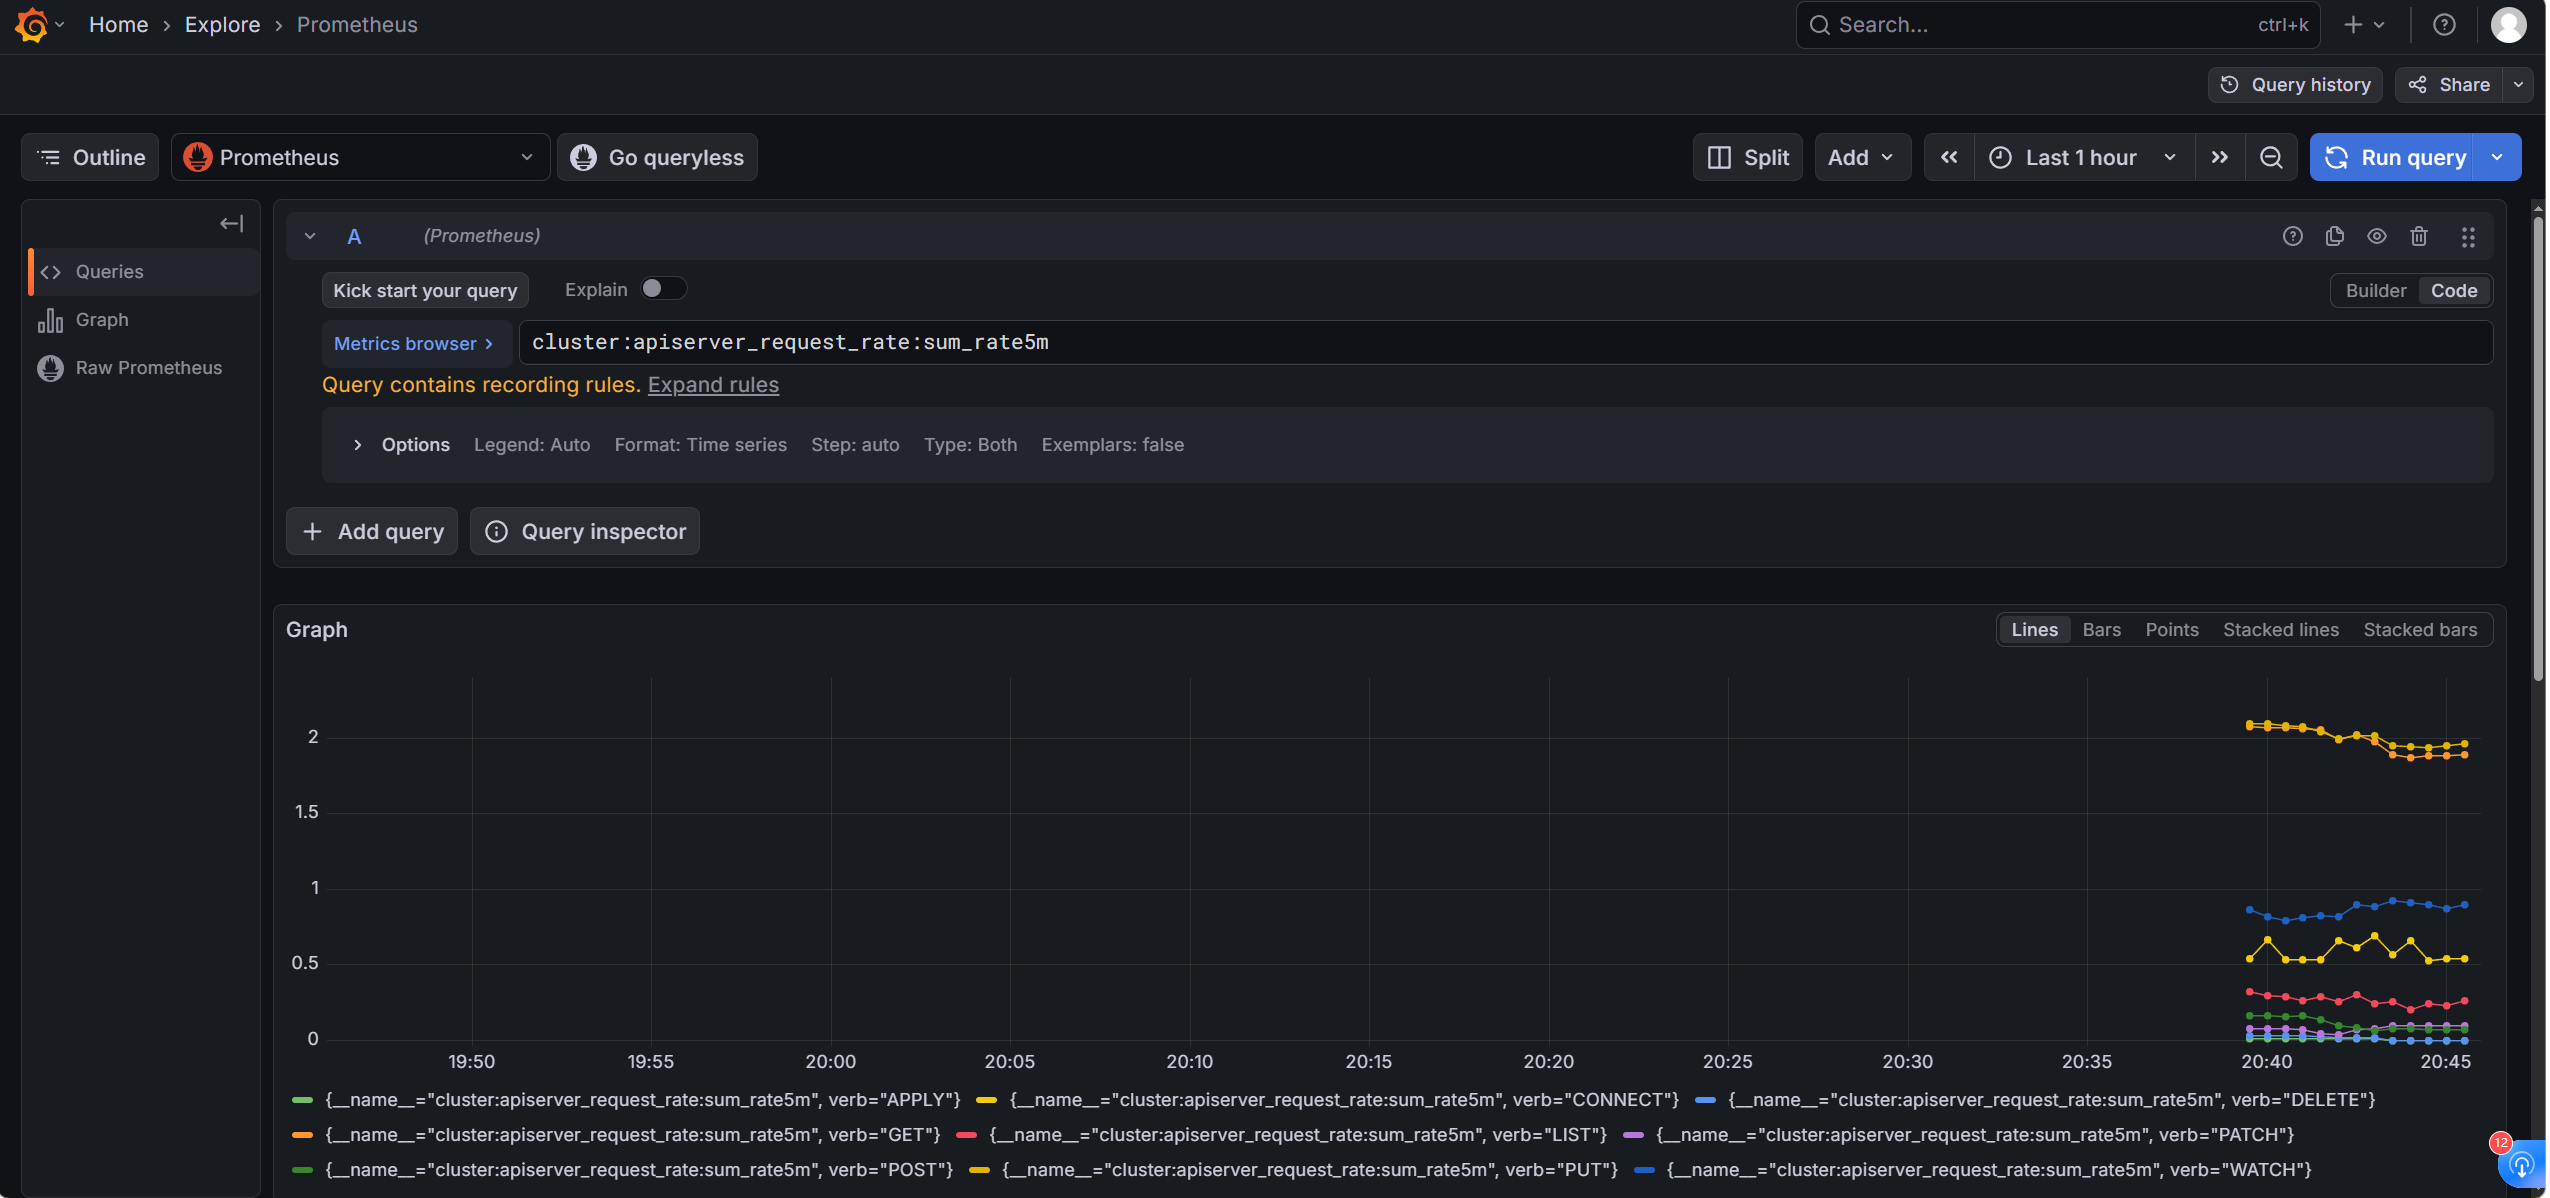
recording rules的核心优势,是将海量数据进行提前计算
比如cpu mem使用率这类基础的数据,如果节点只有10 50台可能无所谓,查询的时候感觉不出区别,但如果有500台,那是否使用recording rules的差异就会相当明显
编写recording rules——使用prometheusRule CRD
旨在说明如何进行recording rules配置编写与使用,这种方式也是kube-prometheus-stack使用的方式,是使用Operator的原生方式
1
2
3
4
5
6
7
8
9
10
11
12
13
14
15
16
17
18
19
20
21
22
23
24
25
26
27
28
29
30
31
32
33
34
35
36
37
38
39
40
41
42
43
44
45
46
47
48
49
50
51
52
53
54
55
56
57
58
59
60
61
62
63
64
65
66
67
68
69
70
71
72
73
74
| apiVersion: monitoring.coreos.com/v1
kind: PrometheusRule
metadata:
name: custom-recording-rules
namespace: monitoring
labels:
release: prometheus
spec:
groups:
- name: node_recording_rules
interval: 30s
rules:
- record: node:cpu_usage:avg_rate5m
expr: |
avg by (instance) (
rate(node_cpu_seconds_total{mode!="idle"}[5m])
)
- record: node:mem_usage:ratio
expr: |
1 - node_memory_MemAvailable_bytes / node_memory_MemTotal_bytes
- record: node:disk_usage:ratio
expr: |
1 - node_filesystem_avail_bytes{fstype!~"tmpfs|overlay|squashfs"}
/ node_filesystem_size_bytes{fstype!~"tmpfs|overlay|squashfs"}
- record: node:network_receive:rate5m
expr: |
sum by (instance) (
rate(node_network_receive_bytes_total{device!="lo"}[5m])
)
- name: container_recording_rules
interval: 30s
rules:
- record: container:cpu_usage:rate5m
expr: |
sum by (namespace, pod, container) (
rate(container_cpu_usage_seconds_total{container!=""}[5m])
)
- record: container:mem_working_set:bytes
expr: |
sum by (namespace, pod, container) (
container_memory_working_set_bytes{container!=""}
)
- record: container:cpu_throttled:ratio
expr: |
sum by (namespace, pod, container) (
rate(container_cpu_cfs_throttled_periods_total{container!=""}[5m])
)
/
sum by (namespace, pod, container) (
rate(container_cpu_cfs_periods_total{container!=""}[5m])
)
- record: container:mem_limit_usage:ratio
expr: |
container_memory_working_set_bytes{container!=""}
/
kube_pod_container_resource_limits{resource="memory"}
|
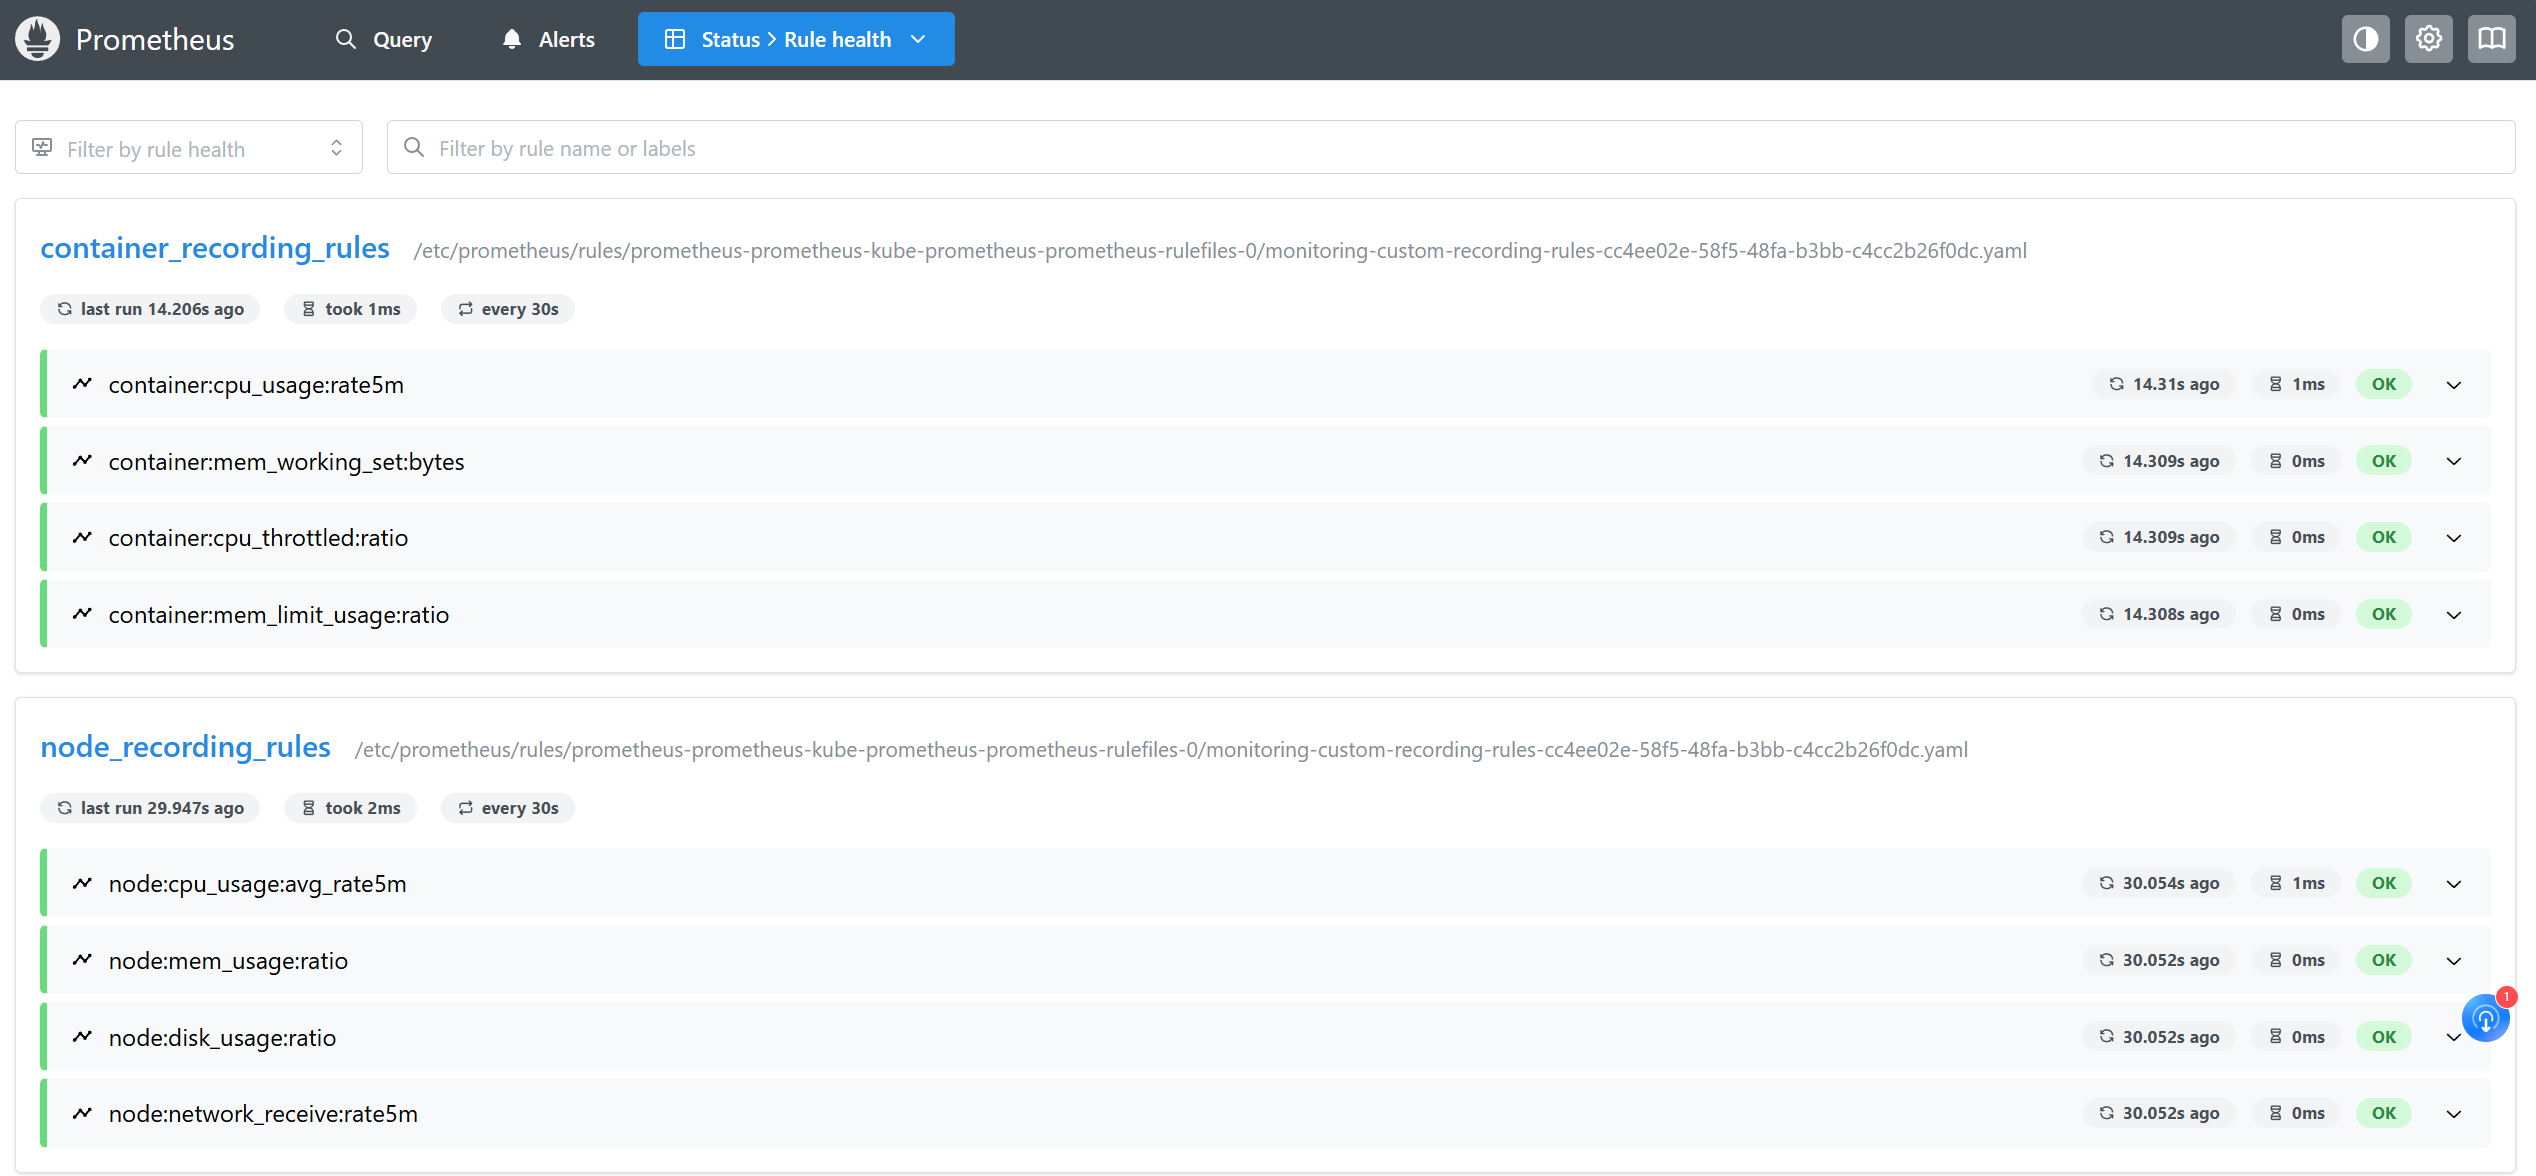
查看prometheusd规则是否生效
使用recording rules
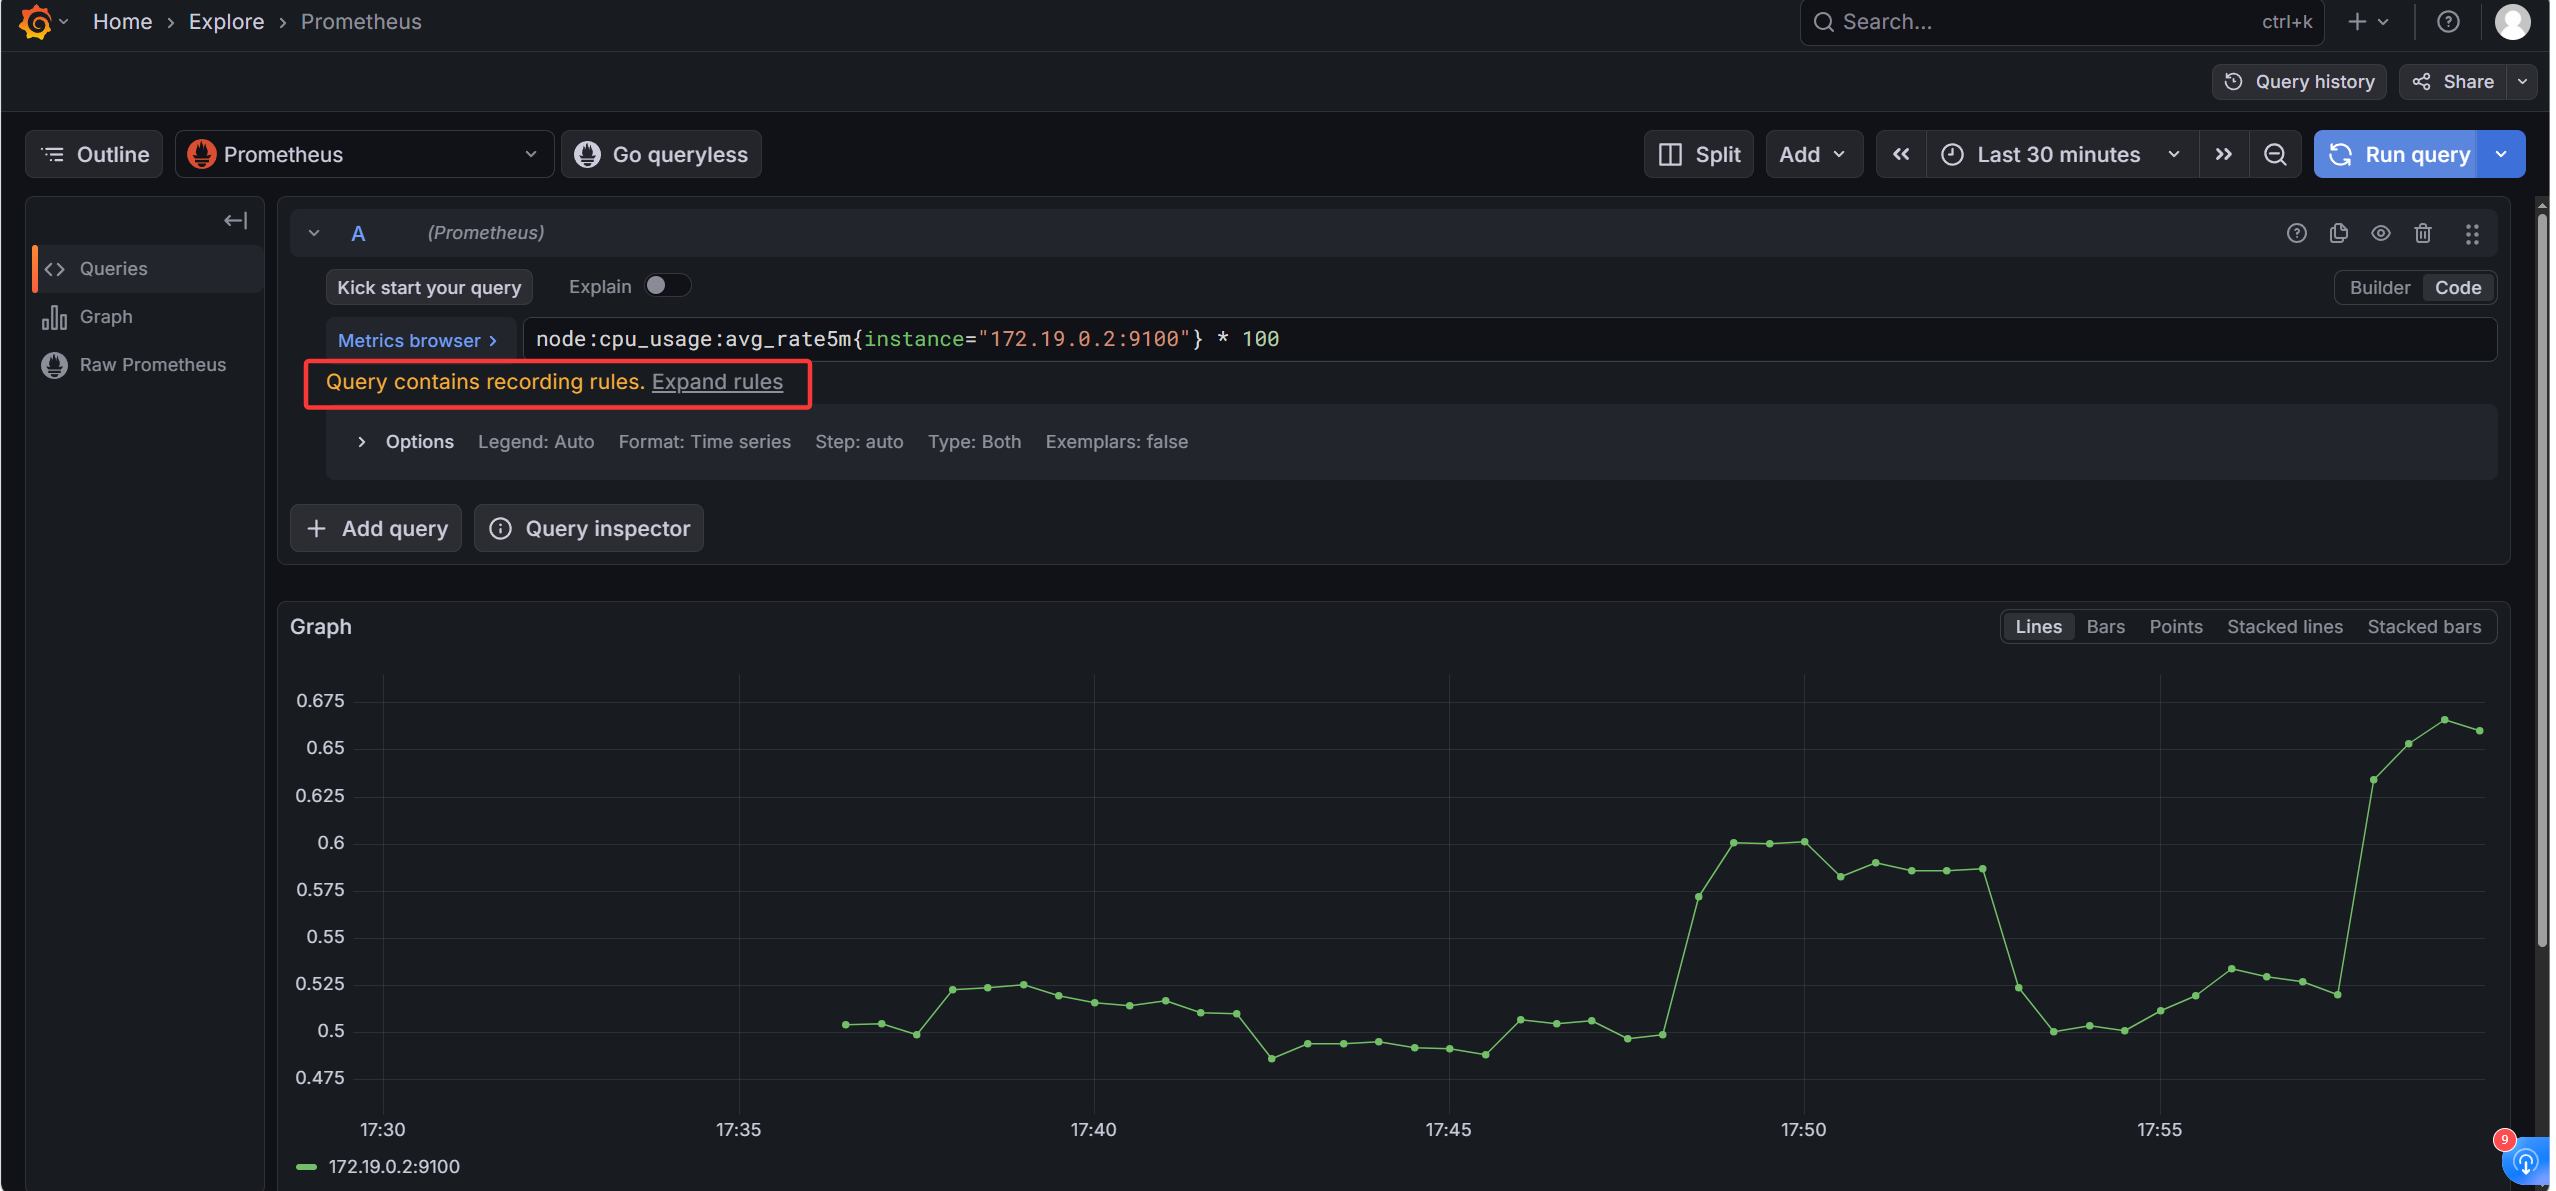
直接在grafana中进行查询,带上查询条件就可以查询到,甚至可以服用到其他的告警规则中
红框是这个版本的grafana可以直接解析聚合的告警,老版本好像没有这个功能
管理recording rules——集成consul
consul tempalte渲染prometheusRule,化整为零
准备consul kv目录结构
1
2
3
4
5
6
7
8
9
10
11
12
13
14
15
16
17
18
19
20
21
22
23
24
25
26
27
28
29
30
31
32
33
34
35
36
37
38
39
| 目录结构
consul kv
└── record-rule/
├── node/
├── pod/
└── cluster/
cluster级别聚合告警:
- name: cluster_recording_rules
interval: 30s
rules:
- expr: |
sum by (verb) (
rate(apiserver_request_total{code!~"5.."}[5m])
)
record: cluster:apiserver_request_rate:sum_rate5m
- expr: |
sum by (verb) (
rate(apiserver_request_total{code=~"5.."}[5m])
)
/
sum by (verb) (
rate(apiserver_request_total[5m])
)
record: cluster:apiserver_error_rate:ratio_rate5m
- expr: |
sum(
increase(etcd_server_leader_changes_seen_total[1h])
)
record: cluster:etcd_leader_changes:sum_increase1h
- expr: |
histogram_quantile(0.99,
rate(etcd_disk_wal_fsync_duration_seconds_bucket[5m])
)
record: cluster:etcd_wal_fsync_p99:histogram_quantile5m
|
准备consul-template模板
根据上面我写的这个consul kv的格式写,感觉其实也不难,因为其实和helm的go语言渲染的方式其实也差不多
创建对应格式的PrometheusRule模板
{{- range $item := tree “record-rule/“ }} → 循环,遍历record-rule/下的文件
{{ $item.Value | indent 2 }} → 取当前values的值,且增加两格缩进
{{- end }} → 循环结束
1
2
3
4
5
6
7
8
9
10
11
12
| apiVersion: monitoring.coreos.com/v1
kind: PrometheusRule
metadata:
name: custom-recording-rules
namespace: monitoring
labels:
release: prometheus
spec:
groups:
{{- range $item := tree "record-rule/" }}
{{ $item.Value | indent 2 }}
{{- end }}
|
创建consul-template
这个tempalte要带kubectl命令,所以从bitnami/kubectl:latest做init容器复制过来,自己打镜像太麻烦了,搞一个通用的yaml
1
2
3
4
5
6
7
8
9
10
11
12
13
14
15
16
17
18
19
20
21
22
23
24
25
26
27
28
29
30
31
32
33
34
35
36
37
38
39
40
41
42
43
44
45
46
47
48
49
50
51
52
53
54
55
56
57
58
59
60
61
62
63
64
65
66
67
68
69
70
71
72
73
74
75
76
77
78
79
80
81
82
83
84
85
86
87
88
89
90
91
92
93
94
95
96
97
98
99
100
101
102
103
104
105
106
107
108
109
110
111
112
113
114
115
116
117
| ---
apiVersion: v1
kind: ServiceAccount
metadata:
name: consul-template-prometheus
namespace: monitoring
---
apiVersion: rbac.authorization.k8s.io/v1
kind: ClusterRole
metadata:
name: consul-template-prometheus
rules:
- apiGroups: ["monitoring.coreos.com"]
resources: ["prometheusrules"]
verbs: ["get", "list", "create", "update", "patch"]
---
apiVersion: rbac.authorization.k8s.io/v1
kind: ClusterRoleBinding
metadata:
name: consul-template-prometheus
roleRef:
apiGroup: rbac.authorization.k8s.io
kind: ClusterRole
name: consul-template-prometheus
subjects:
- kind: ServiceAccount
name: consul-template-prometheus
namespace: monitoring
---
apiVersion: v1
kind: ConfigMap
metadata:
name: consul-template-prometheus-tmpl
namespace: monitoring
data:
recording-rules.yml.ctmpl: |
apiVersion: monitoring.coreos.com/v1
kind: PrometheusRule
metadata:
name: custom-recording-rules
namespace: monitoring
labels:
release: prometheus
spec:
groups:
{{- range $item := tree "record-rule/" }}
{{ $item.Value | indent 4 }}
{{- end }}
---
apiVersion: apps/v1
kind: Deployment
metadata:
name: consul-template-prometheus
namespace: monitoring
spec:
replicas: 1
selector:
matchLabels:
app: consul-template-prometheus
template:
metadata:
labels:
app: consul-template-prometheus
spec:
serviceAccountName: consul-template-prometheus
shareProcessNamespace: true
initContainers:
- name: kubectl-init
image: bitnami/kubectl:latest
command: ["cp", "/opt/bitnami/kubectl/bin/kubectl", "/kubectl-bin/kubectl"]
volumeMounts:
- name: kubectl-bin
mountPath: /kubectl-bin
containers:
- name: consul-template
image: hashicorp/consul-template:0.39.0
command:
- consul-template
- -consul-addr=consul-consul-server.consul.svc.cluster.local:8500
- -template=/etc/ct-templates/recording-rules.yml.ctmpl:/etc/rendered/recording-rules.yml:/kubectl-bin/kubectl apply -f /etc/rendered/recording-rules.yml
- -log-level=info
resources:
requests:
cpu: 10m
memory: 32Mi
limits:
cpu: 50m
memory: 64Mi
volumeMounts:
- name: ct-templates
mountPath: /etc/ct-templates
- name: rendered
mountPath: /etc/rendered
- name: kubectl-bin
mountPath: /kubectl-bin
volumes:
- name: ct-templates
configMap:
name: consul-template-prometheus-tmpl
- name: rendered
emptyDir: {}
- name: kubectl-bin
emptyDir: {}
kubectl apply -f consul-template.yaml
serviceaccount/consul-template-prometheus created
clusterrole.rbac.authorization.k8s.io/consul-template-prometheus created
clusterrolebinding.rbac.authorization.k8s.io/consul-template-prometheus created
configmap/consul-template-prometheus-tmpl created
deployment.apps/consul-template-prometheus created
|
测试consul kv管理record-rule
1
2
3
| 首先要把我之前prometheusRule CRD的那个删了,不然这里体现不出来
cd victoria-metrics/charts/victoria-metrics-cluster/
kubectl delete -f node_recording_rules.yaml
|