如果出现无法载图的情况,请检查与github的连通性
概述 Prometheus是一个开源的系统监控和报警系统,现在已经加入到CNCF基金会,成为继k8s之后第二个在CNCF托管的项目,在kubernetes容器管理系统中,通常会搭配prometheus进行监控,同时也支持多种exporter采集数据,还支持pushgateway进行数据上报,Prometheus性能足够支撑上万台规模的集群。
特点 对于同一个数据可以打不通的标签,进行分流
样本 在时间序列中的每一个点称为一个样本(sample),样本由以下三部分组成:
监控的资源 普罗米修斯对kubernetes的监控:
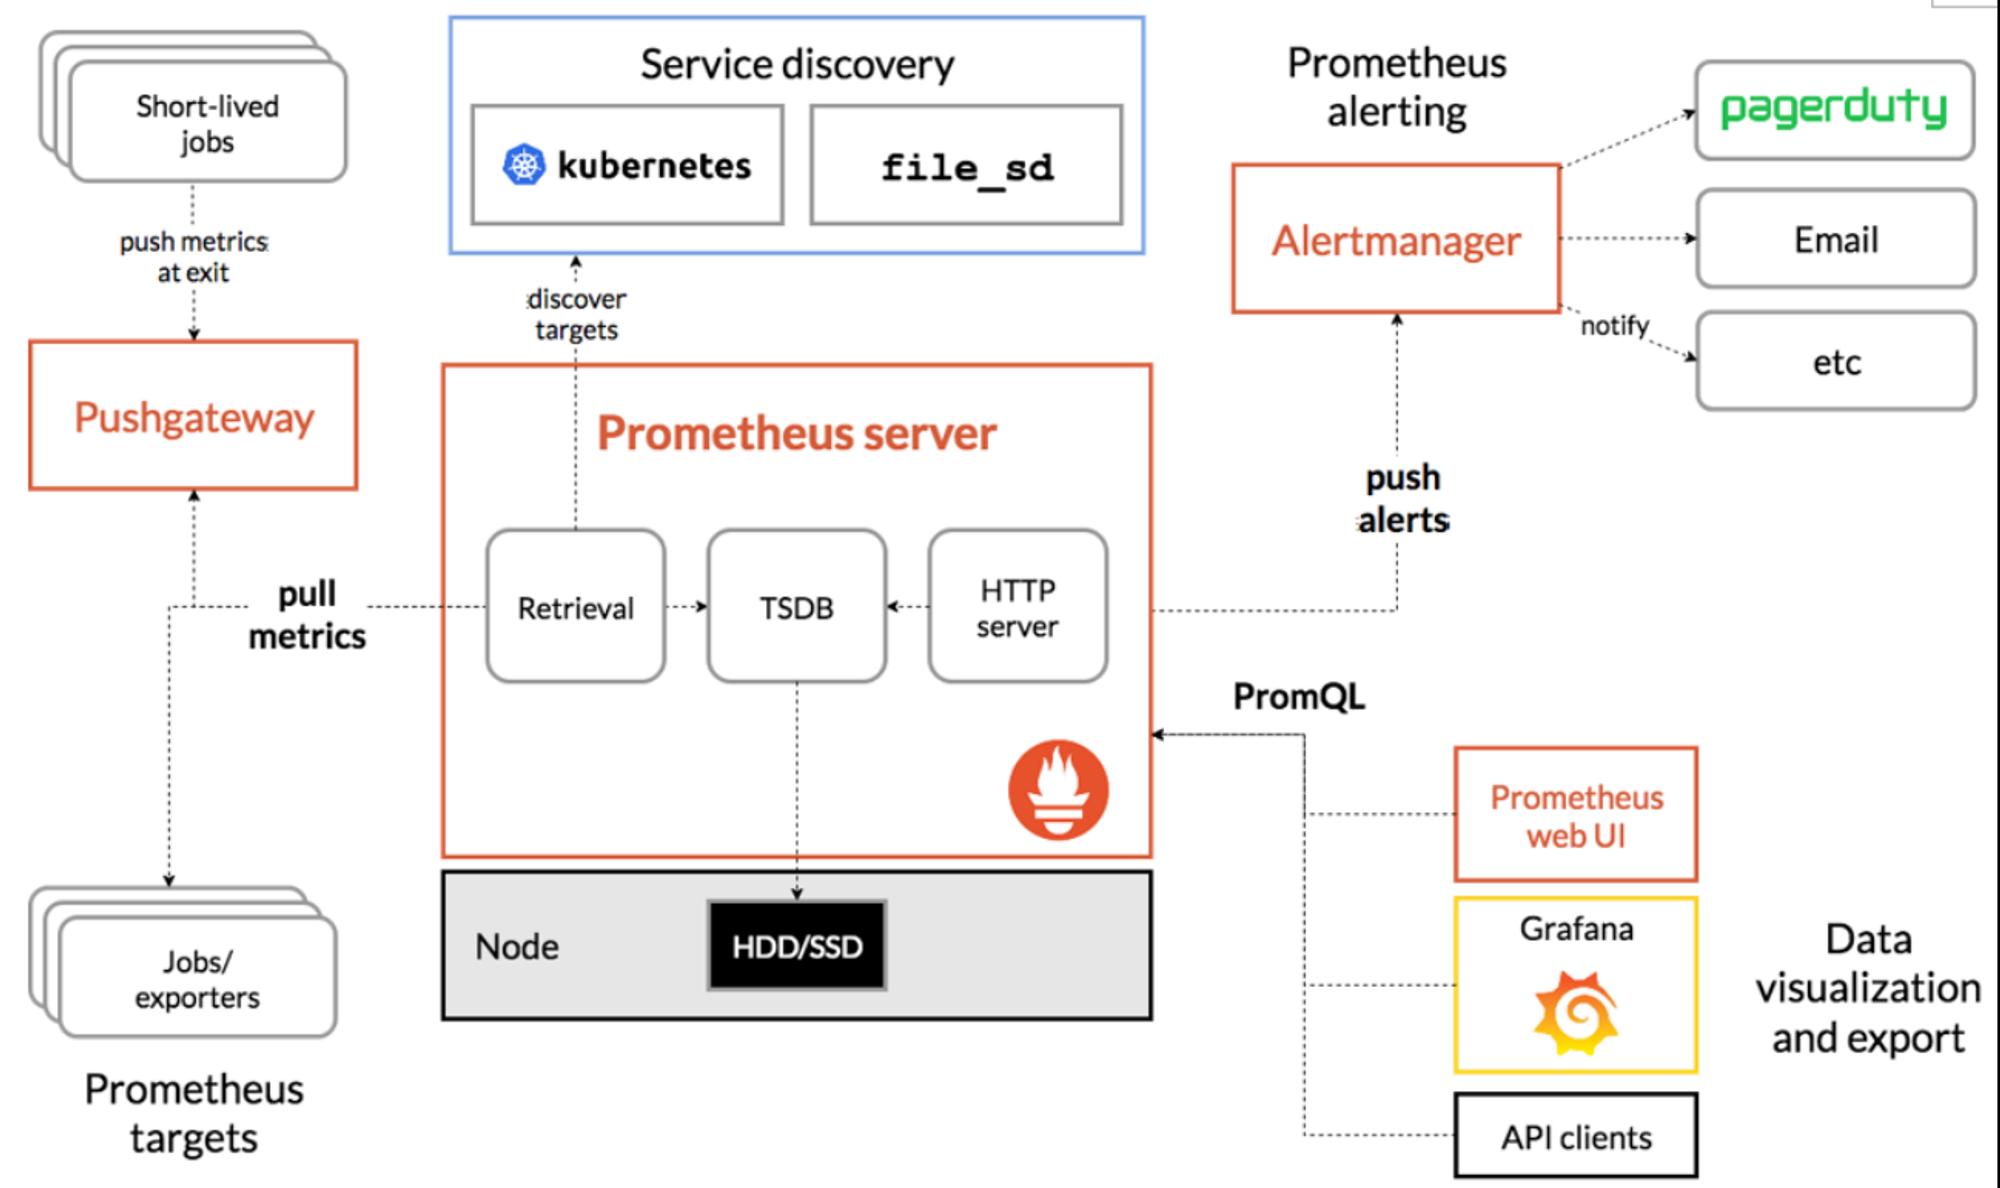
普罗米修斯架构 普罗米修斯可以通过服务发现来采集数据,通过targets表现出来;可以通过alertmanager来进行告警的推送;外接告警面板比如Prometheus web UI或者grafana来通过PromQL进行查询
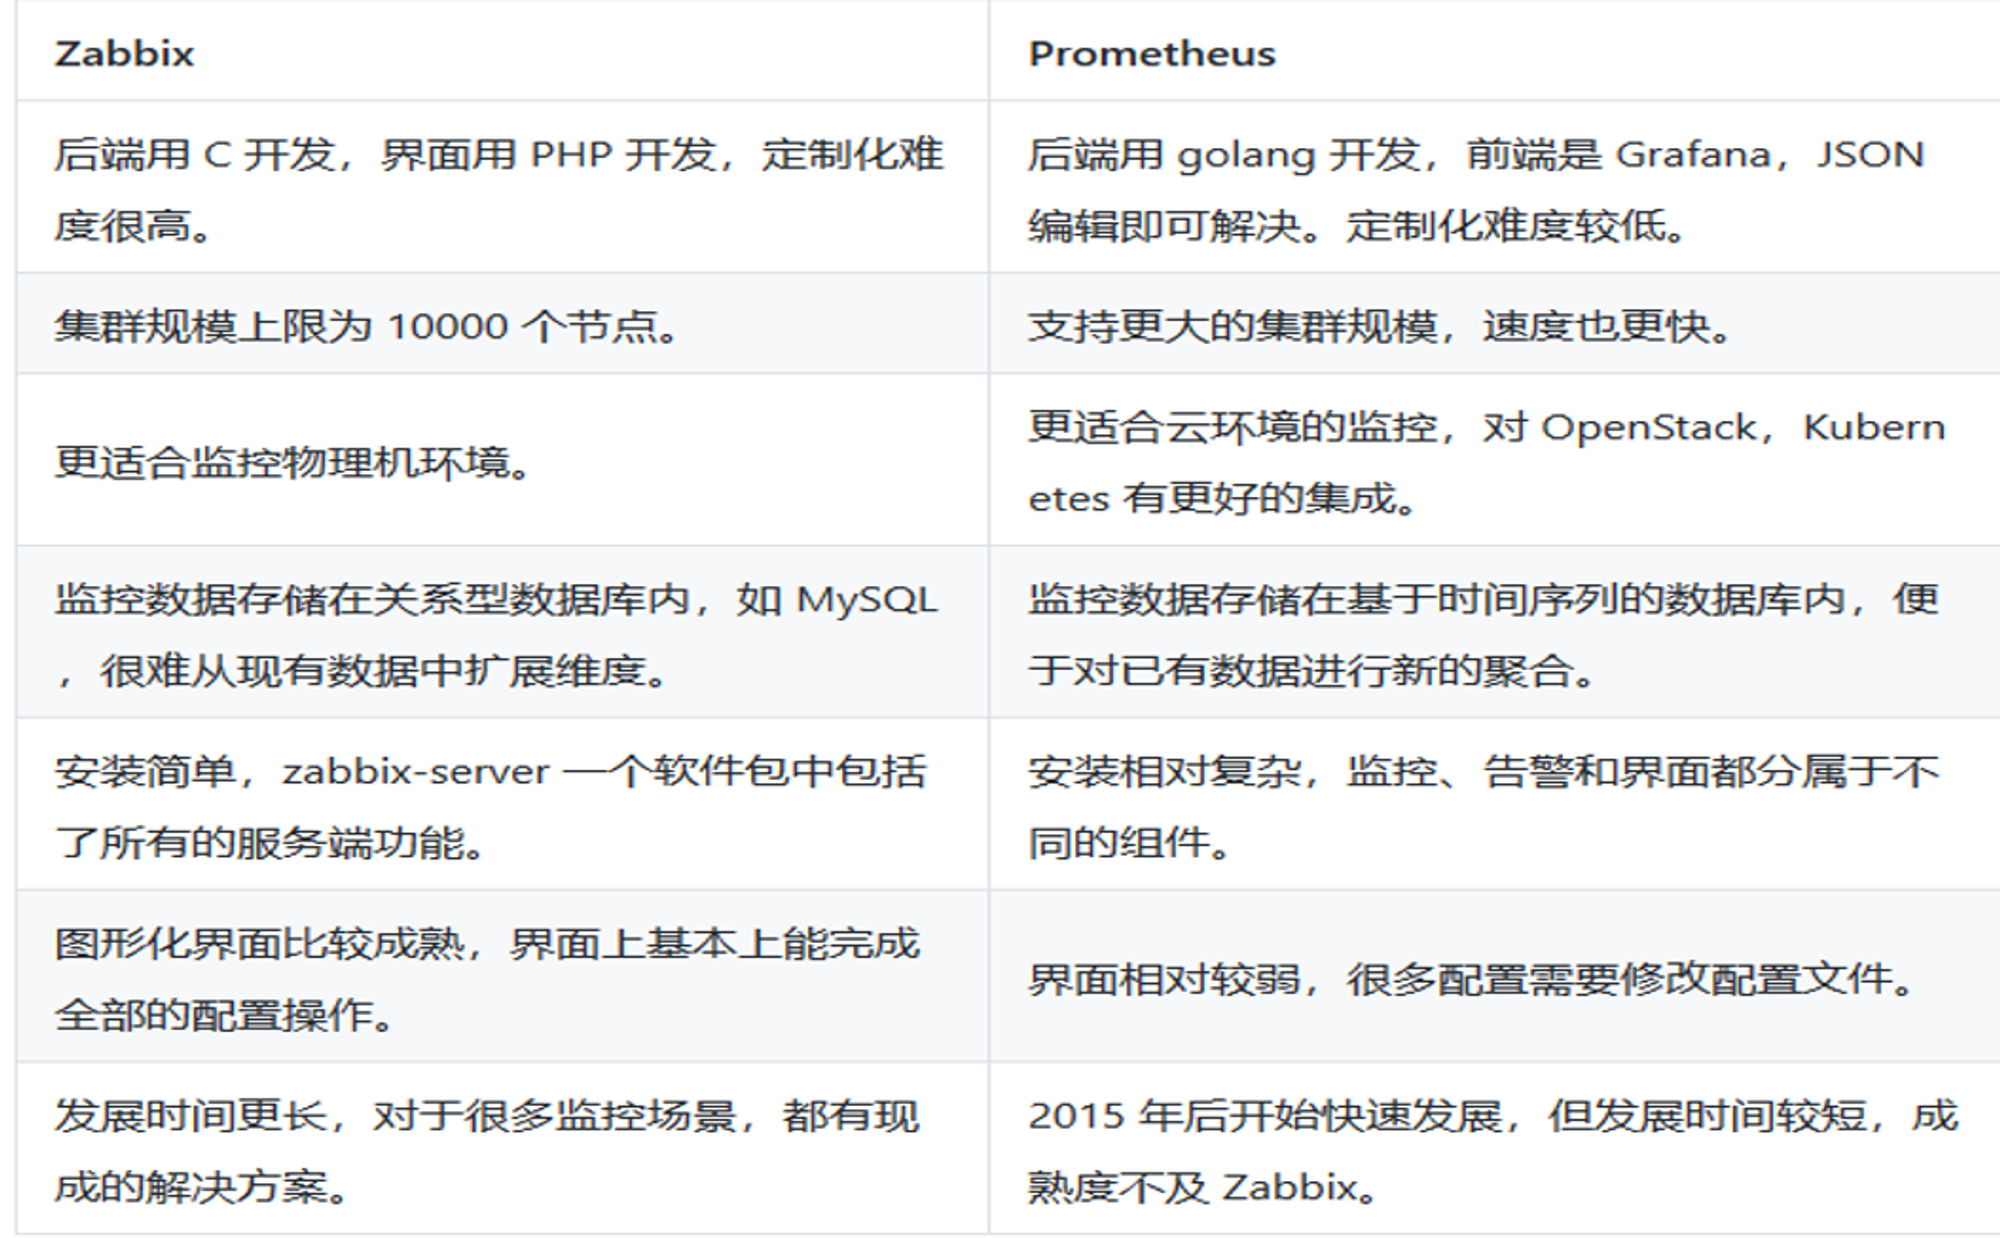
与zabbix的对比:
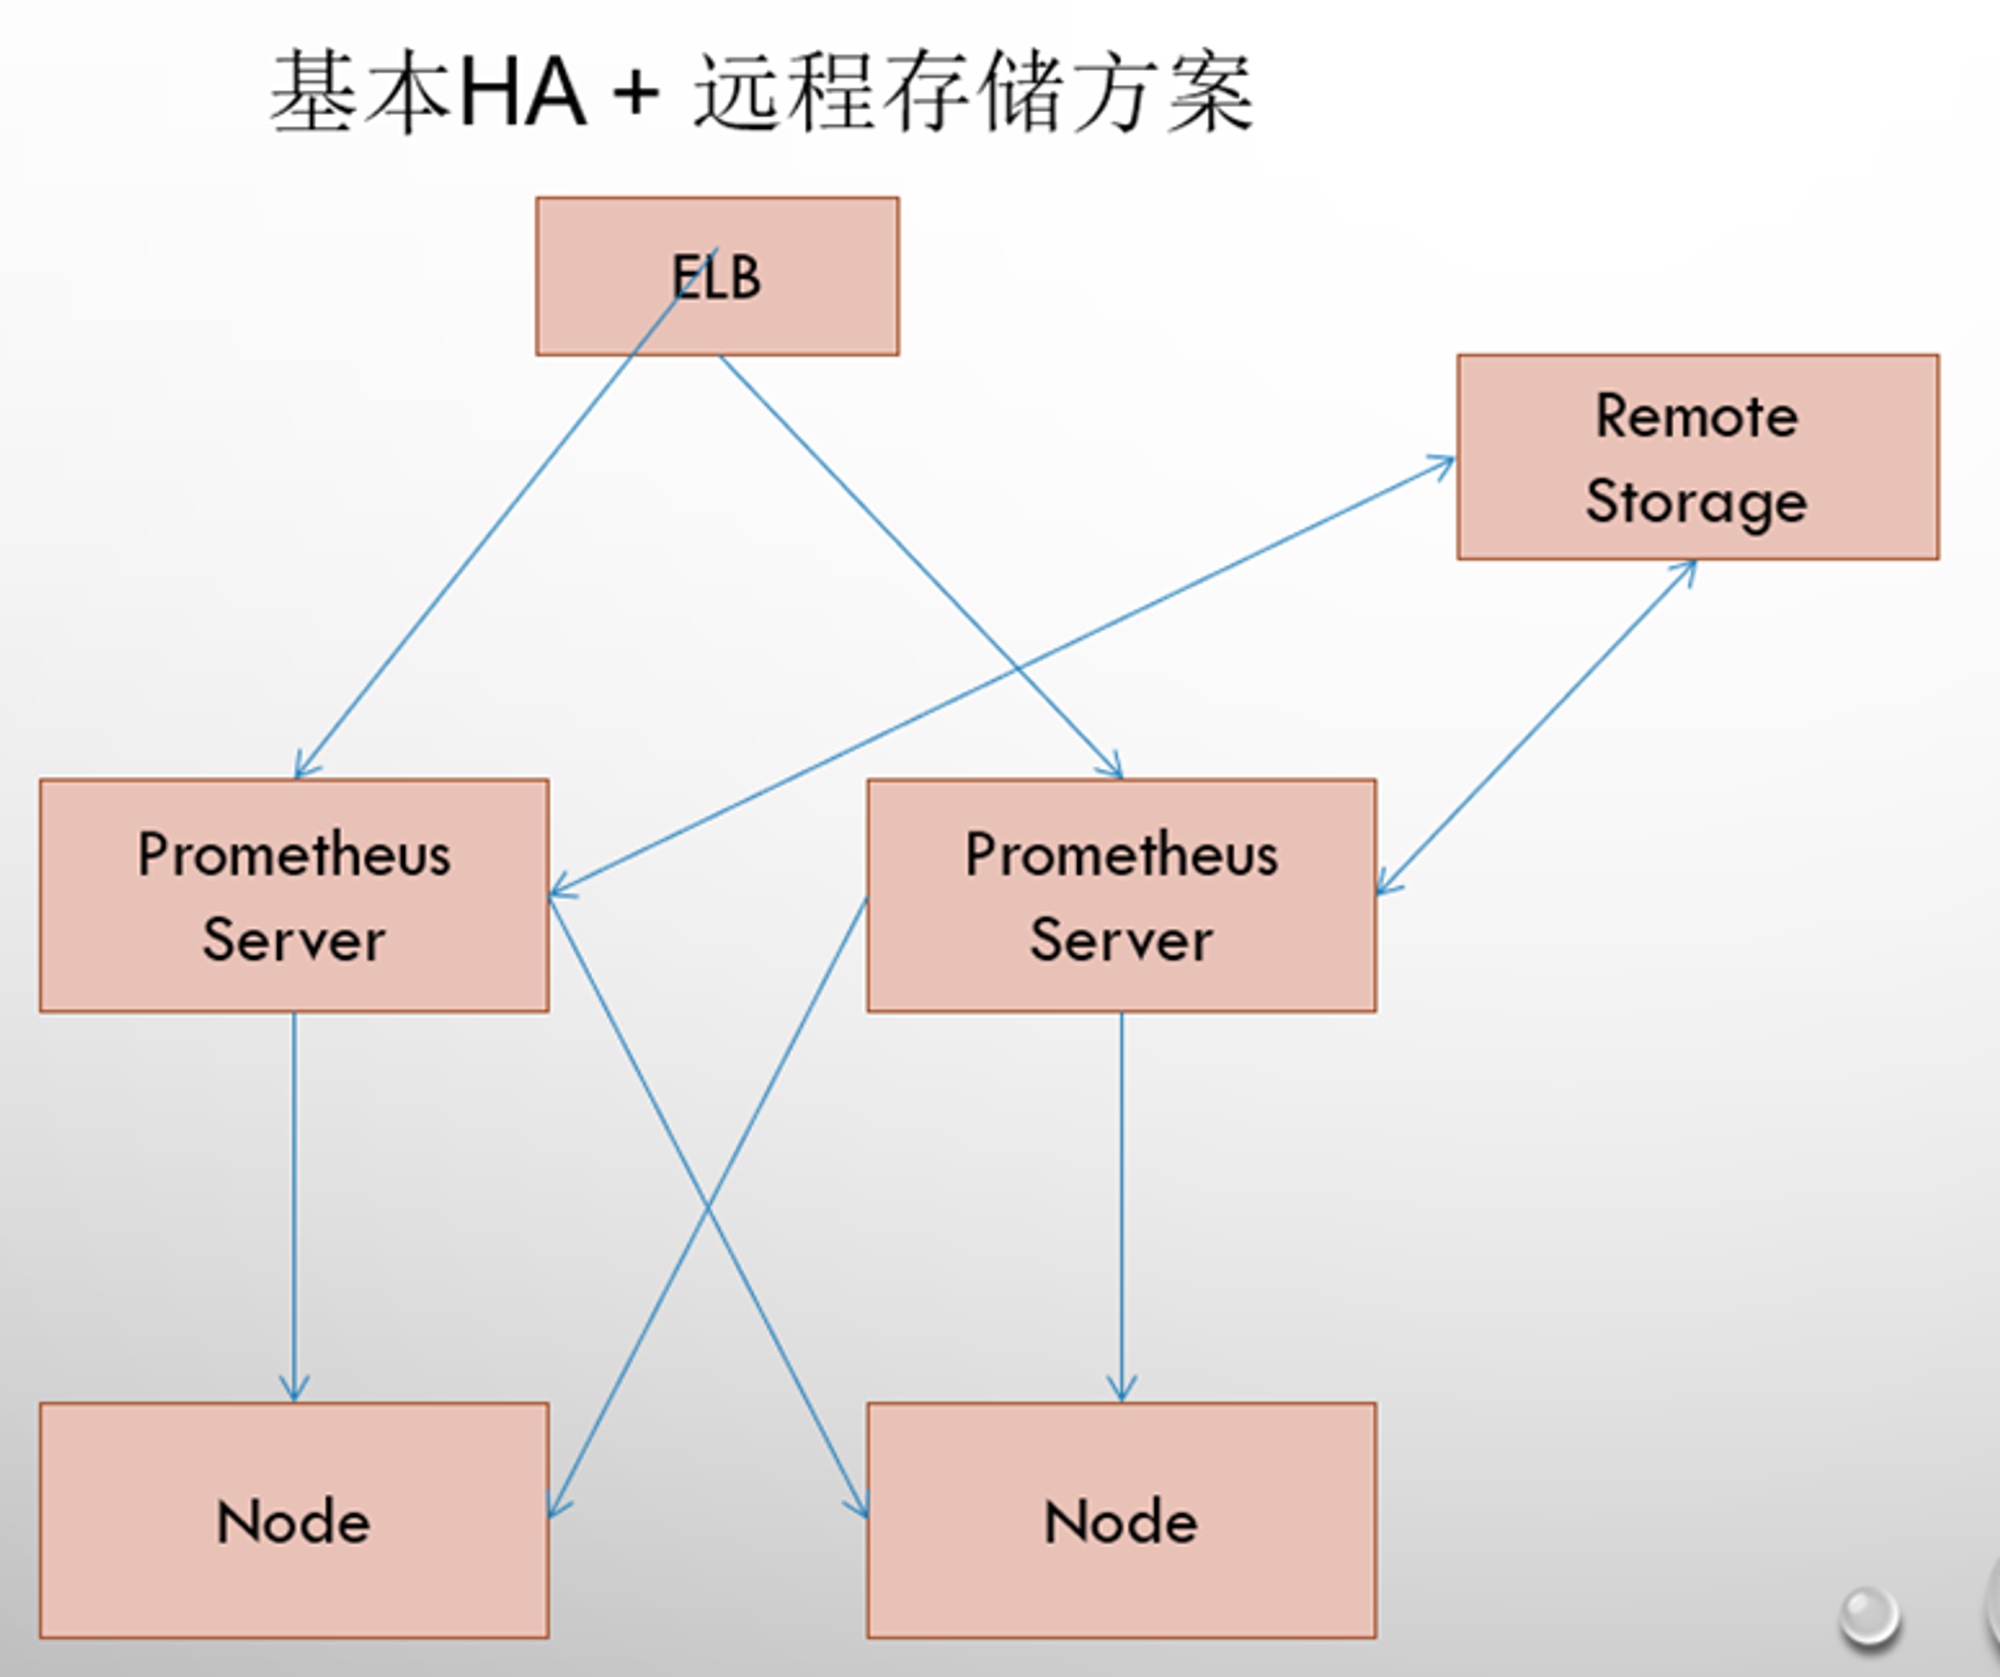
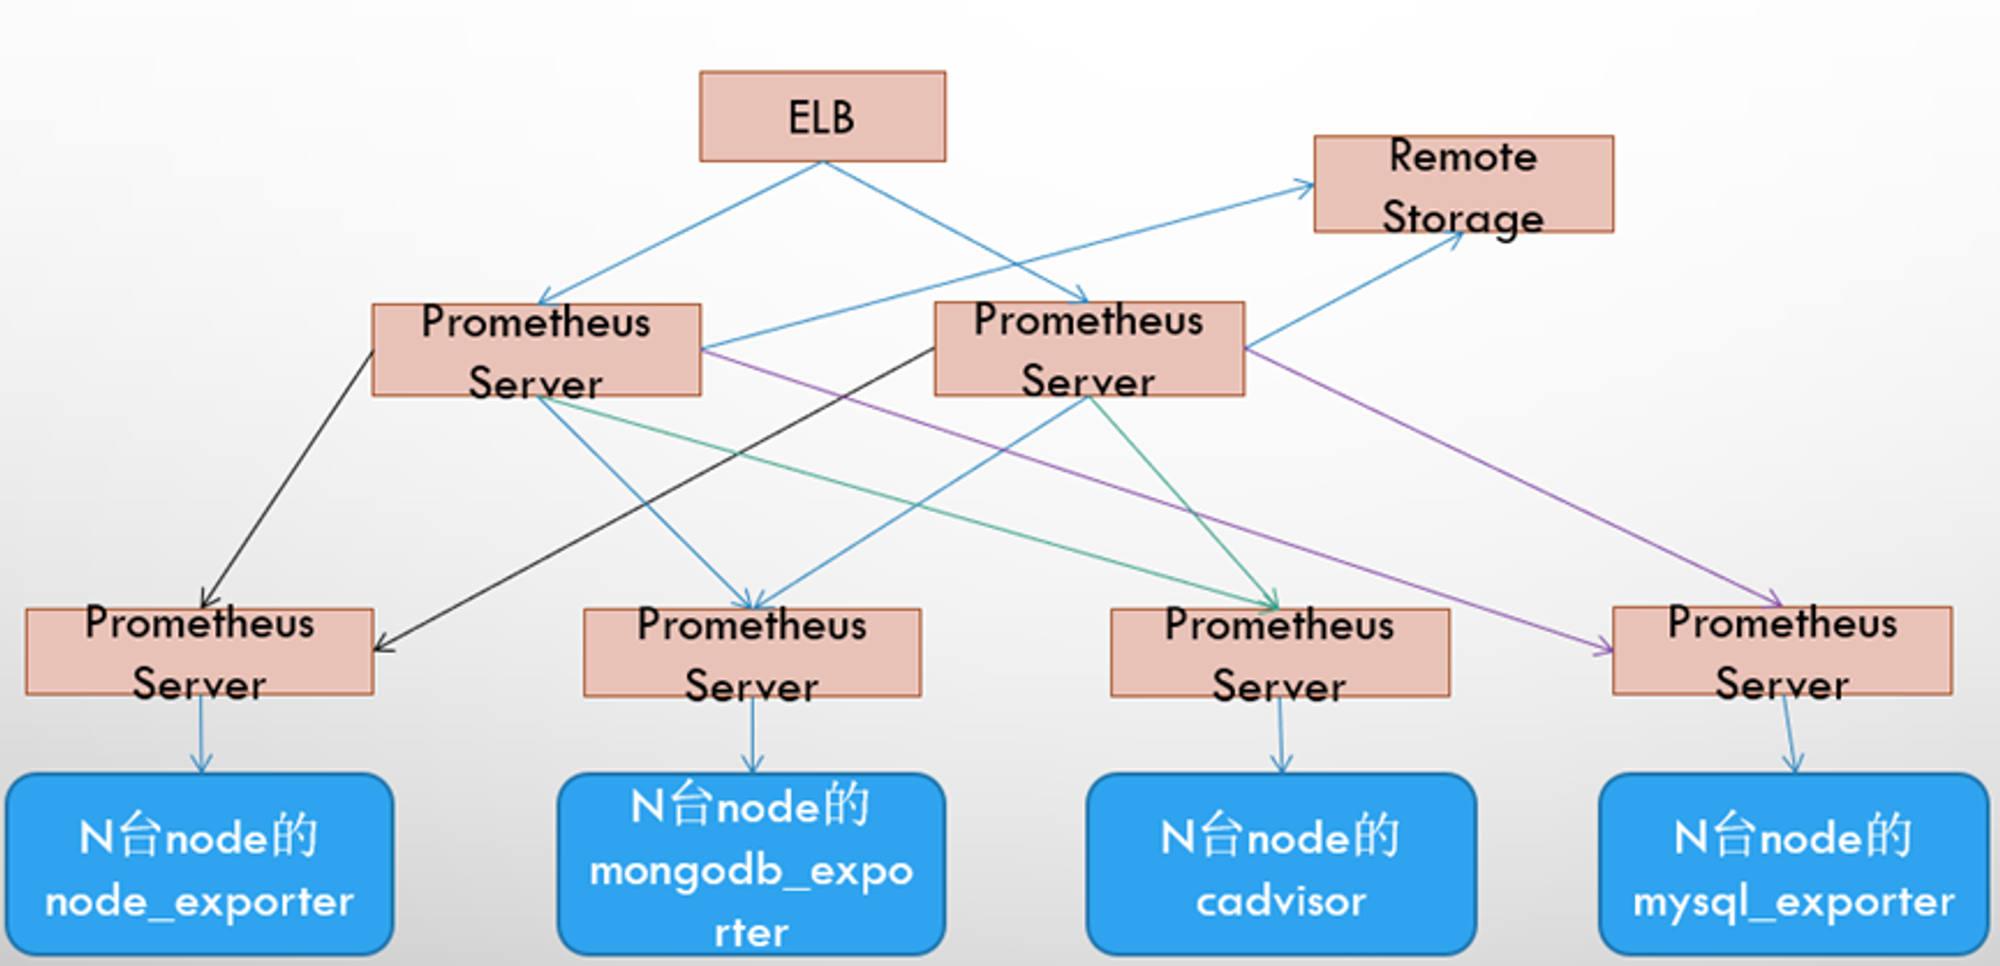
高可用方案
每个普罗米修斯都采集不同的采样,上传到上级普罗米修斯
Prometheus安装与部署 node-exporter组件安装与配置 node-exporter组件可以采集及其的监控指标数据
在github下载最新版的node-exporter安装包
https://github.com/prometheus/node_exporter/releases/tag/v1.7.0
上传到各个节点并解压crictl -n=k8s.io images import node_exporter-1.7.0.linux-amd64.tar.gz
1 2 3 4 5 6 7 8 9 10 11 12 13 14 15 16 17 18 19 20 21 22 23 24 25 26 27 28 29 30 31 32 33 34 35 36 37 38 39 40 41 42 43 44 45 46 47 48 49 50 51 52 53 54 55 56 57 58 59 60 61 62 63 64 65 66 67 68 69 70 71 72 73 74 75 76 77 78 79 80 81 82 83 84 kubectl create ns monitor-sa cat > node-exporter.yaml << EOF apiVersion: apps/v1 kind: DaemonSet #可以保证k8s集群的每个节点都运行完全一样的pod metadata: name: node-exporter namespace: monitor-sa labels: name: node-exporter spec: selector: matchLabels: name: node-exporter template: metadata: labels: name: node-exporter spec: hostPID: true hostIPC: true hostNetwork: true # hostNetwork、hostIPC、hostPID都为True时,表示这个Pod里的所有容器,会直接使用宿主机的网络,直接与宿主机进行IPC(进程间通信)通信,可以看到宿主机里正在运行的所有进程。 加入了hostNetwork:true会直接将我们的宿主机的9100端口映射出来,从而不需要创建service 在我们的宿主机上就会有一个9100的端口 containers: - name: node-exporter image: quay.io/prometheus/node-exporter:latest imagePullPolicy: IfNotPresent ports: - containerPort: 9100 #exporter默认监听端口为9100 resources: requests: cpu: 0.15 #这个容器运行至少需要0.15核cpu securityContext: privileged: true #开启特权模式 args: - --path.procfs #配置挂载宿主机(node节点)的路径,cpu与内存信息等 - /host/proc - --path.sysfs #配置挂载宿主机(node节点)的路径 - /host/sys - --collector.filesystem.ignored-mount-points - '"^/(sys|proc|dev|host|etc)($|/)"' #通过正则表达式忽略某些文件系统挂载点的信息收集 volumeMounts: - name: dev mountPath: /host/dev - name: proc mountPath: /host/proc - name: sys mountPath: /host/sys - name: rootfs mountPath: /rootfs #将主机/dev、/proc、/sys这些目录挂在到容器中,通过这些文件来获取系统信息的。 tolerations: #定义容忍度,允许部署到master节点上 - key: "node-role.kubernetes.io/control-plane" operator: "Exists" effect: "NoSchedule" volumes: - name: proc hostPath: path: /proc - name: dev hostPath: path: /dev - name: sys hostPath: path: /sys - name: rootfs hostPath: path: / EOF kubectl apply -f node-exporter.yaml ubectl get pods -n monitor -owide NAME READY STATUS RESTARTS AGE IP NODE NOMINATED NODE READINESS GATES node-exporter-2llm6 1/1 Running 0 20s 192.168.10.121 ws-k8s-master1 <none> <none> node-exporter-6q49m 1/1 Running 0 20s 192.168.10.122 ws-k8s-master2 <none> <none> node-exporter-jkr9c 1/1 Running 0 7s 192.168.10.131 ws-k8s-node1 <none> <none> node-exporter-qnqzm 1/1 Running 0 9s 192.168.10.133 ws-k8s-node3 <none> <none> node-exporter-wkkgr 1/1 Running 0 8s 192.168.10.132 ws-k8s-node2 <none> <none> curl http://192.168.10.133:9100/metrics
安装Prometheus server 1.创建一个sa名为monitor,并且将其作为user与sa都绑定cluster-admin的clusterrole
1
2
3
4
5
kubectl create sa monitor -n monitor-sa kubectl create clusterrolebinding monitor-clusterrolebinding -n monitor-sa \ --clusterrole=cluster-admin --serviceaccount=monitor-sa:monitor kubectl create clusterrolebinding monitor-clusterrolebinding-1 -n monitor-sa \ --clusterrole=cluster-admin --user=system:serviceaccount:monitor:monitor-sa
2.准备部署的节点上创建存储数据的目录mkdir /datachmod 777 /data
3.创建configmap存储卷来存放Prometheus配置信息
1
2
3
4
5
6
7
8
9
10
11
12
13
14
15
16
17
18
19
20
21
22
23
24
25
26
27
28
29
30
31
32
33
34
35
36
37
38
39
40
41
42
43
44
45
46
47
48
49
50
51
52
53
54
55
56
57
58
59
60
61
62
63
64
65
66
67
68
69
70
71
72
73
74
75
76
77
78
79
80
81
82
83
84
cat > prometheus-cfg.yaml << EOF --- kind: ConfigMap apiVersion: v1 metadata: labels: app: prometheus name: prometheus-config namespace: monitor-sa data: prometheus.yml: | #配置文件 global: #全局配置 scrape_interval: 15s #采集间隔 scrape_timeout: 10s #超时时间 evaluation_interval: 1m #告警的时间间隔 scrape_configs: #数据源 - job_name: 'kubernetes-node' #基于k8s的服务发现 kubernetes_sd_configs: #连接node-exporter - role: node relabel_configs: #对于信息筛选 - source_labels: [__address__] regex: '(.*):10250' #将访问端口变为9100 replacement: '${1}:9100' target_label: __address__ action: replace - action: labelmap regex: __meta_kubernetes_node_label_(.+) - job_name: 'kubernetes-node-cadvisor' #要采集的指标信息 kubernetes_sd_configs: - role: node scheme: https tls_config: ca_file: /var/run/secrets/kubernetes.io/serviceaccount/ca.crt bearer_token_file: /var/run/secrets/kubernetes.io/serviceaccount/token relabel_configs: - action: labelmap regex: __meta_kubernetes_node_label_(.+) - target_label: __address__ replacement: kubernetes.default.svc:443 #集群service的IP - source_labels: [__meta_kubernetes_node_name] regex: (.+) target_label: __metrics_path__ replacement: /api/v1/nodes/${1}/proxy/metrics/cadvisor - job_name: 'kubernetes-apiserver' #监控k8s本身的后端pod kubernetes_sd_configs: - role: endpoints #服务发现-endpoint模式 scheme: https tls_config: ca_file: /var/run/secrets/kubernetes.io/serviceaccount/ca.crt bearer_token_file: /var/run/secrets/kubernetes.io/serviceaccount/token relabel_configs: - source_labels: [__meta_kubernetes_namespace, __meta_kubernetes_service_name, __meta_kubernetes_endpoint_port_name] action: keep regex: default;kubernetes;https - job_name: 'kubernetes-service-endpoints' #监控pod与svc资源 kubernetes_sd_configs: - role: endpoints relabel_configs: - source_labels: [__meta_kubernetes_service_annotation_prometheus_io_scrape] action: keep regex: true - source_labels: [__meta_kubernetes_service_annotation_prometheus_io_scheme] action: replace target_label: __scheme__ regex: (https?) - source_labels: [__meta_kubernetes_service_annotation_prometheus_io_path] action: replace target_label: __metrics_path__ regex: (.+) - source_labels: [__address__, __meta_kubernetes_service_annotation_prometheus_io_port] action: replace target_label: __address__ regex: ([^:]+)(?::\d+)?;(\d+) replacement: $1:$2 - action: labelmap regex: __meta_kubernetes_service_label_(.+) - source_labels: [__meta_kubernetes_namespace] action: replace target_label: kubernetes_namespace - source_labels: [__meta_kubernetes_service_name] action: replace target_label: kubernetes_name EOF kubectl apply -f prometheus-cfg.yaml
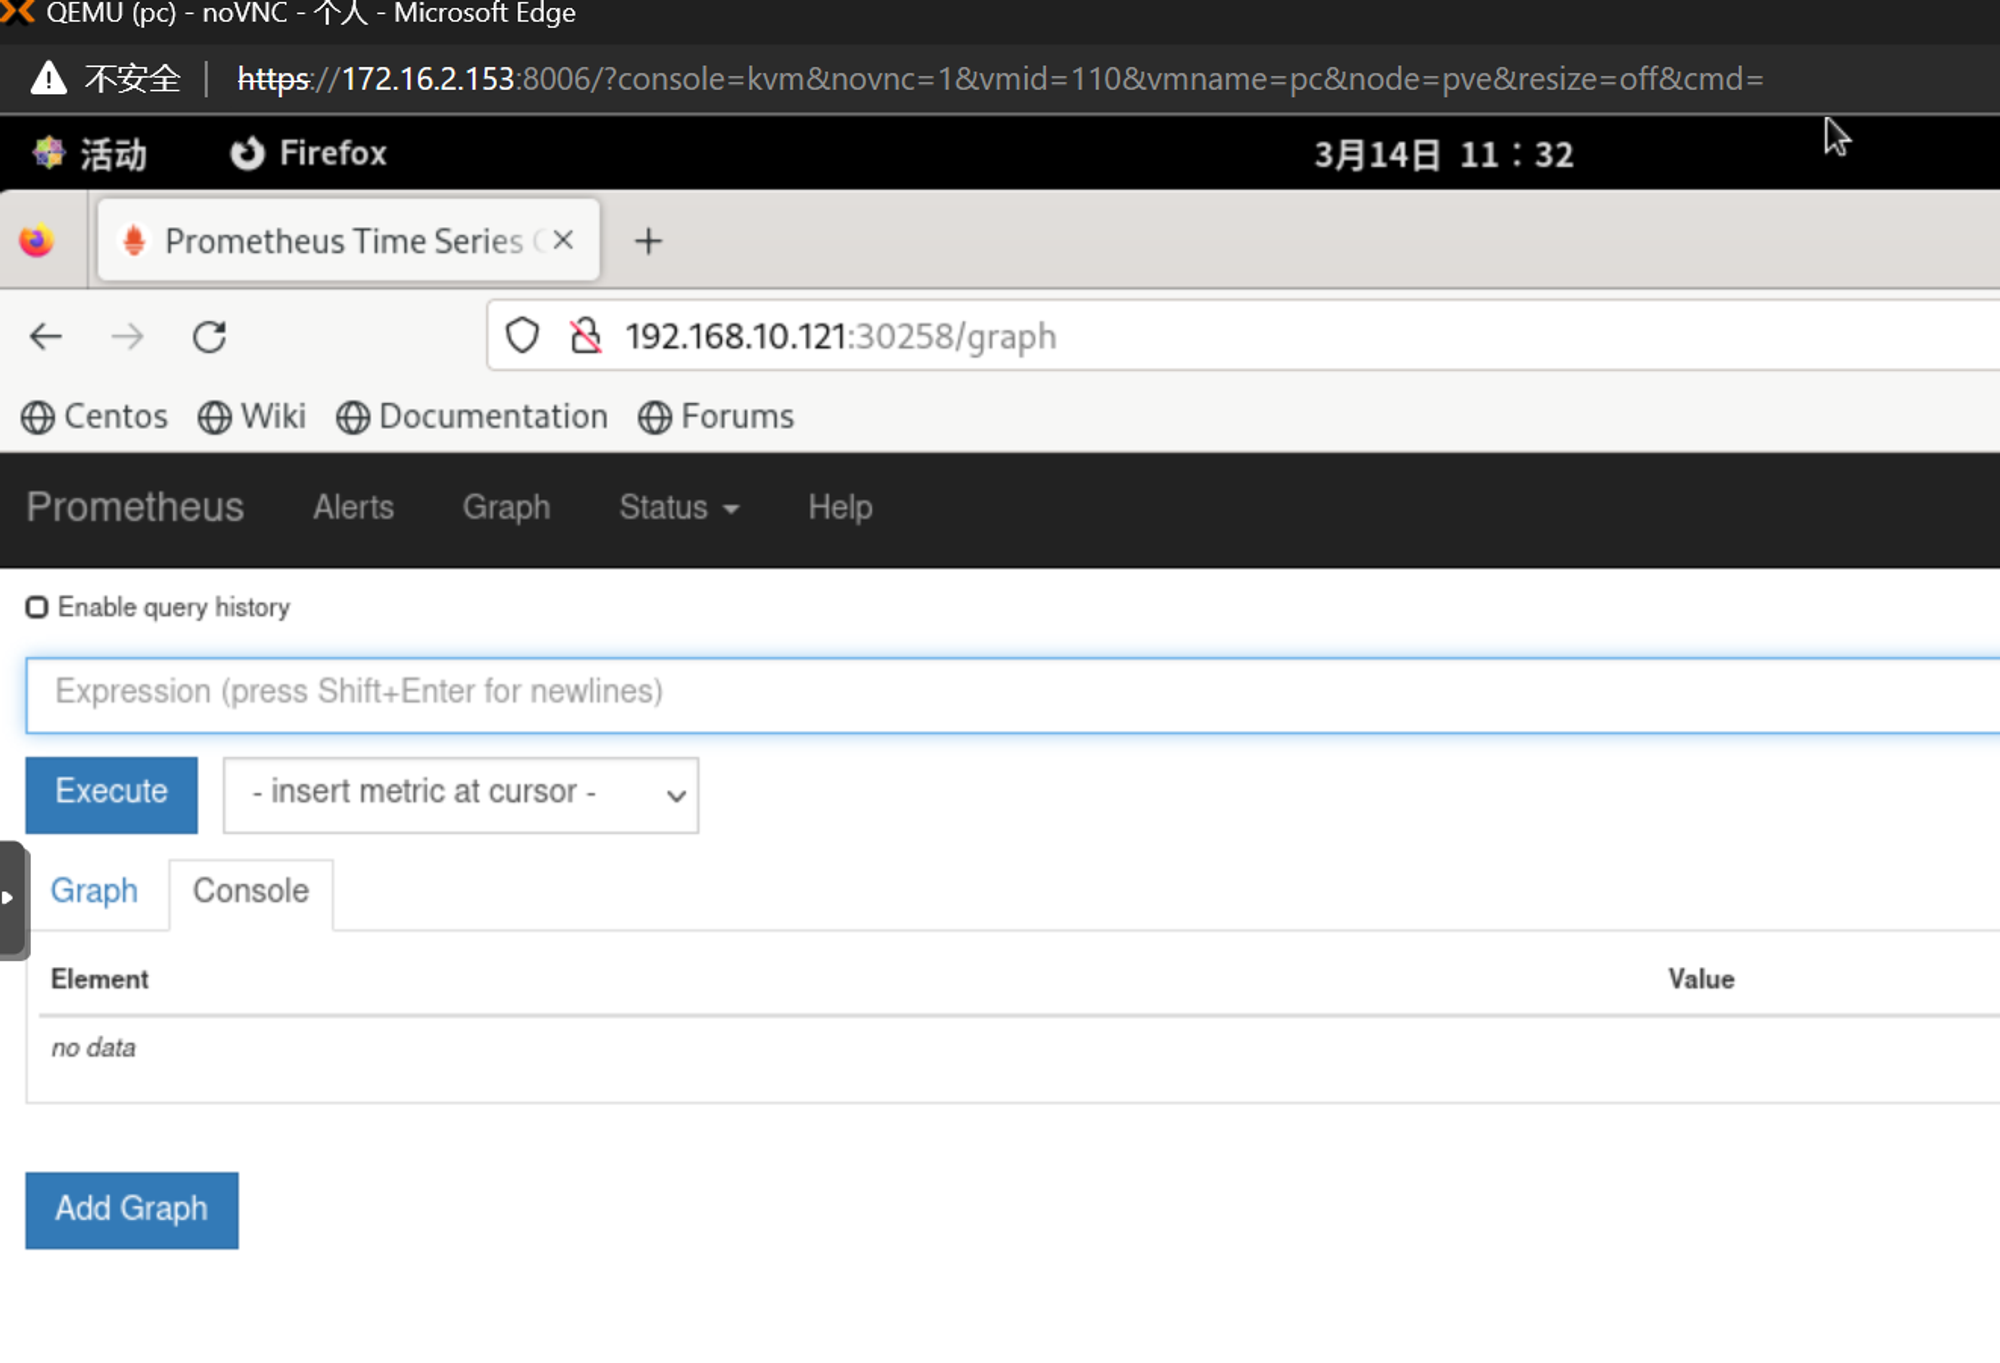
4.通过Deployment部署Prometheus
1
2
3
4
5
6
7
8
9
10
11
12
13
14
15
16
17
18
19
20
21
22
23
24
25
26
27
28
29
30
31
32
33
34
35
36
37
38
39
40
41
42
43
44
45
46
47
48
49
50
51
52
53
54
55
56
57
58
59
60
61
62
63
64
65
66
67
68
69
70
71
72
73
74
75
76
77
78
79
80
81
82
83
84
85
86
87
88
cat > prometheus-deploy.yaml << EOF --- apiVersion: apps/v1 kind: Deployment metadata: name: prometheus-server namespace: monitor labels: app: prometheus spec: replicas: 1 selector: matchLabels: app: prometheus component: server #matchExpressions: #- {key: app, operator: In, values: [prometheus]} #- {key: component, operator: In, values: [server]} template: metadata: labels: app: prometheus component: server annotations: prometheus.io/scrape: 'false' spec: nodeName: ws-k8s-node1 serviceAccountName: monitor containers: - name: prometheus image: prom/prometheus:v2.2.1 imagePullPolicy: IfNotPresent command: - prometheus - --config.file=/etc/prometheus/prometheus.yml - --storage.tsdb.path=/prometheus - --storage.tsdb.retention=720h - --web.enable-lifecycle ports: - containerPort: 9090 protocol: TCP volumeMounts: - mountPath: /etc/prometheus name: prometheus-config - mountPath: /prometheus/ name: prometheus-storage-volume volumes: - name: prometheus-config configMap: name: prometheus-config - name: prometheus-storage-volume hostPath: path: /data type: Directory EOF kubectl apply -f prometheus-deploy.yaml cat > prometheus-svc.yaml << EOF apiVersion: v1 kind: Service metadata: name: prometheus namespace: monitor-sa labels: app: prometheus spec: type: NodePort ports: - port: 9090 targetPort: 9090 protocol: TCP selector: app: prometheus component: server EOF kubectl apply -f prometheus-svc.yaml kubectl get svc -n monitor-sa NAME TYPE CLUSTER-IP EXTERNAL-IP PORT(S) AGE prometheus NodePort 10.106.206.187 <none> 9090:30258/TCP 8s 如果在svc中增加相关的注解,就可以让service本身的状态被抓取 ... annotations: prometheus.io/scrape: "true" prometheus.io/port: "9090" ...
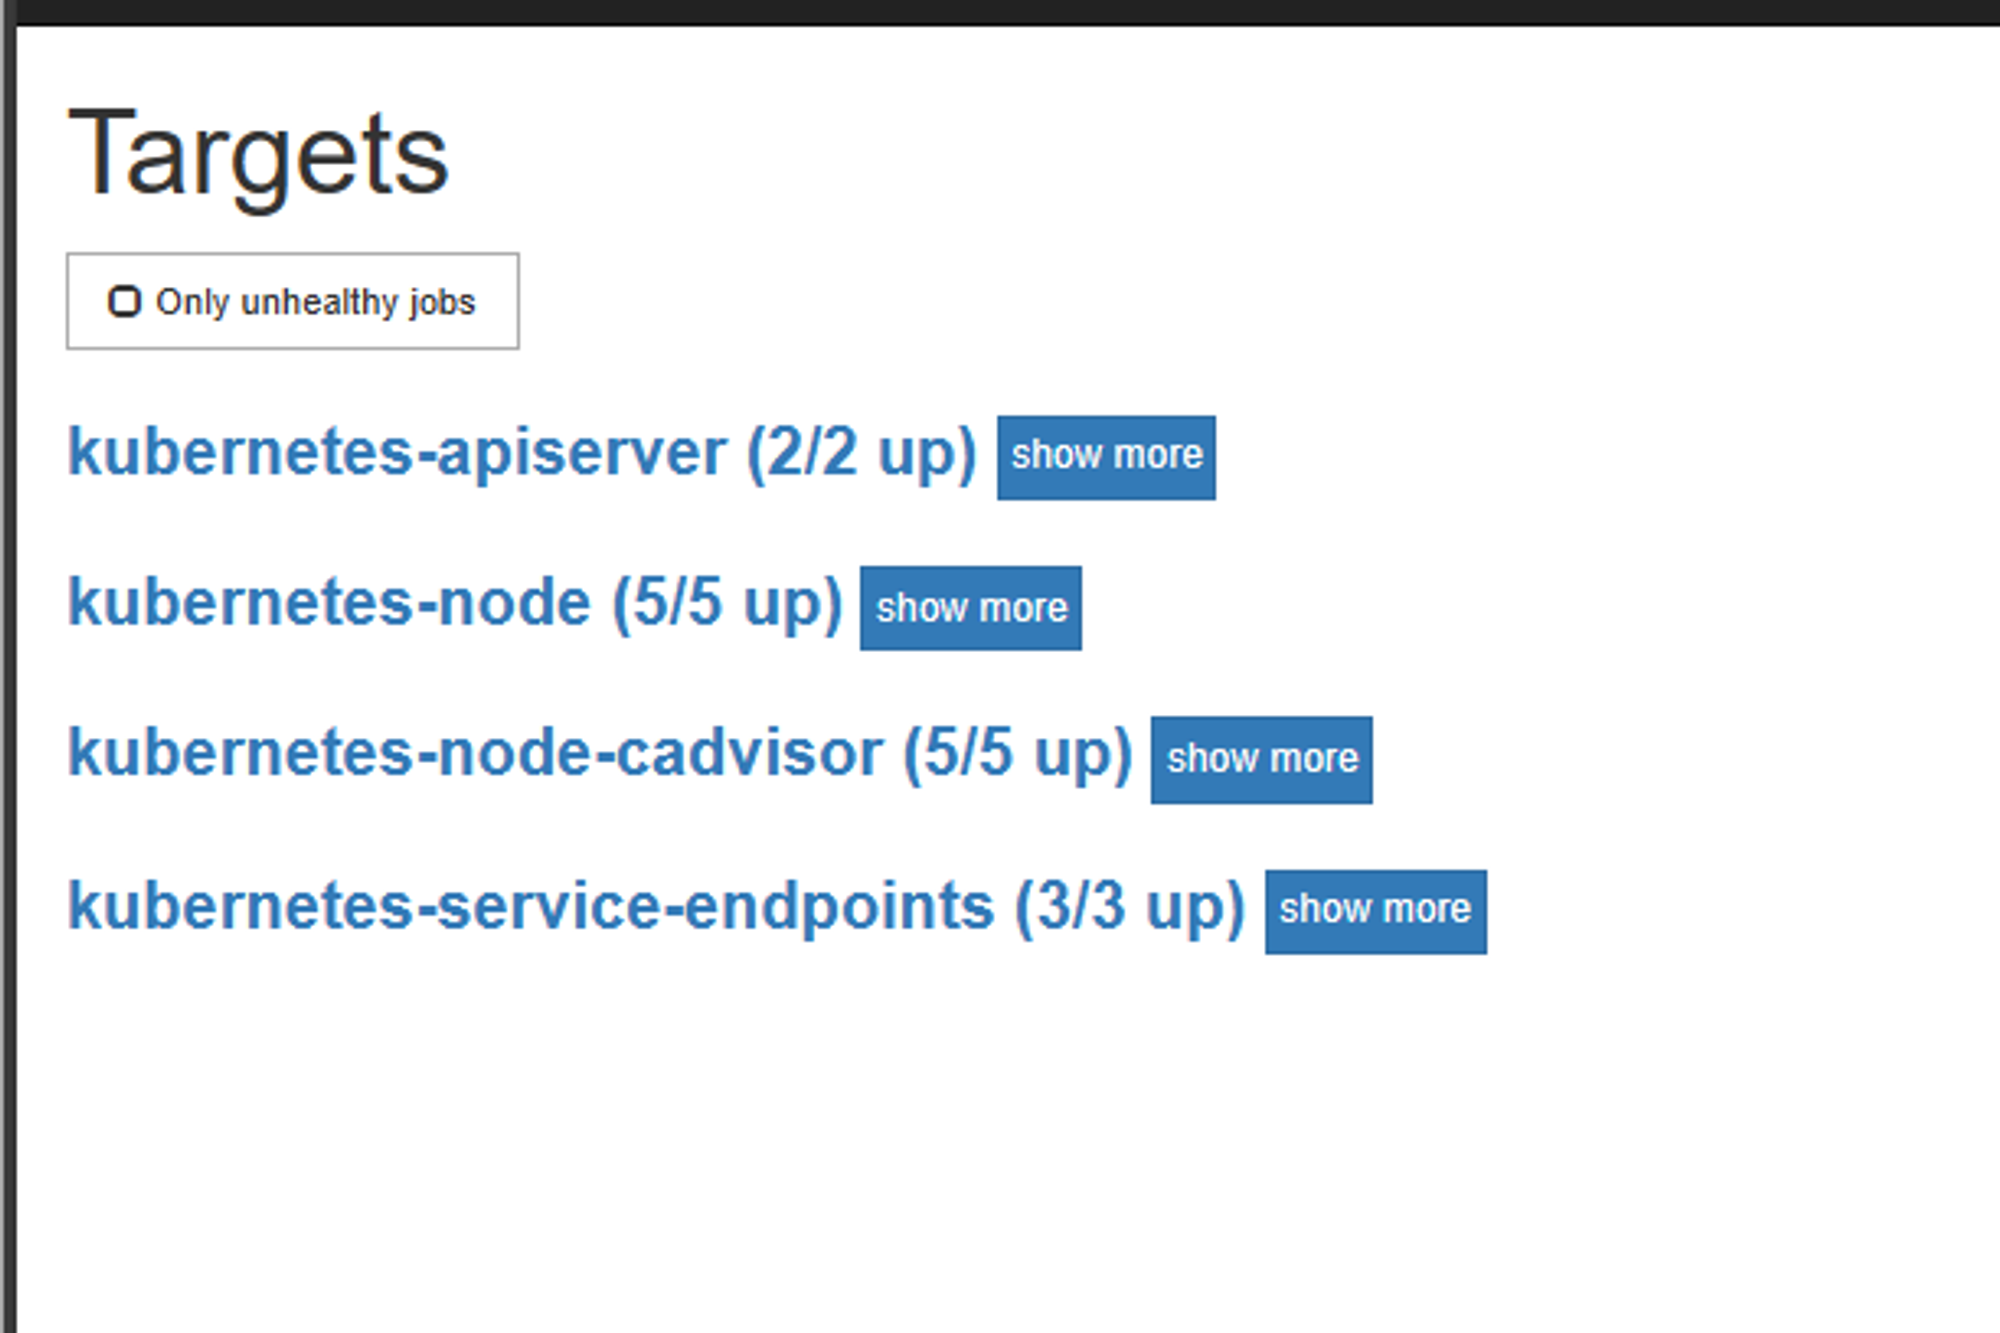
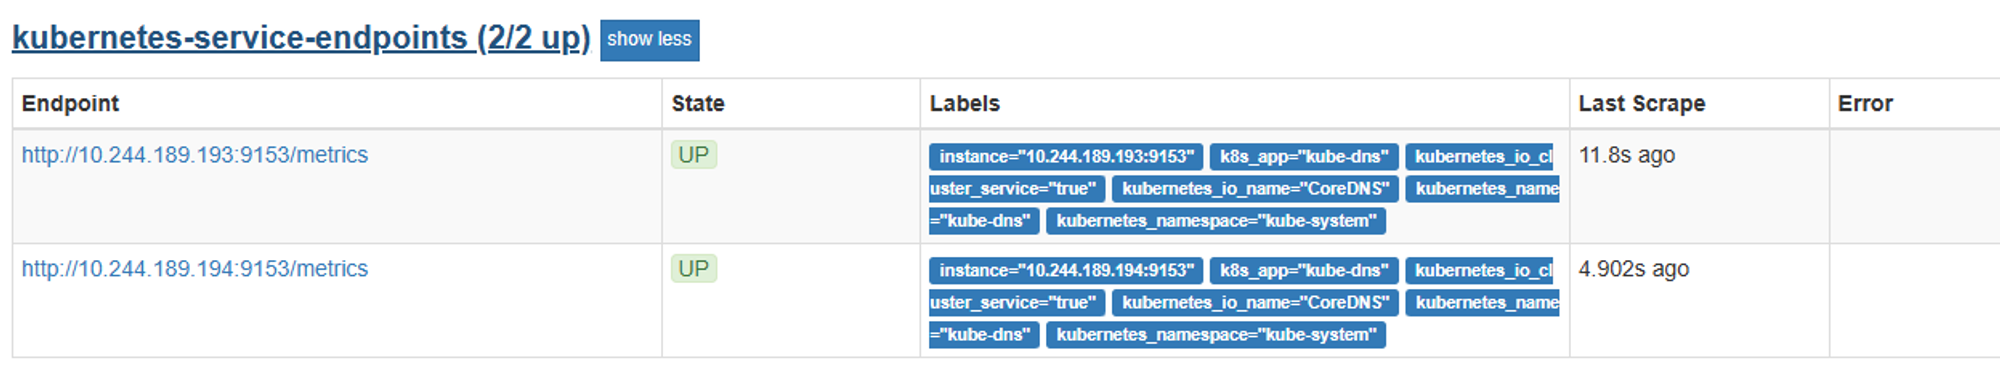
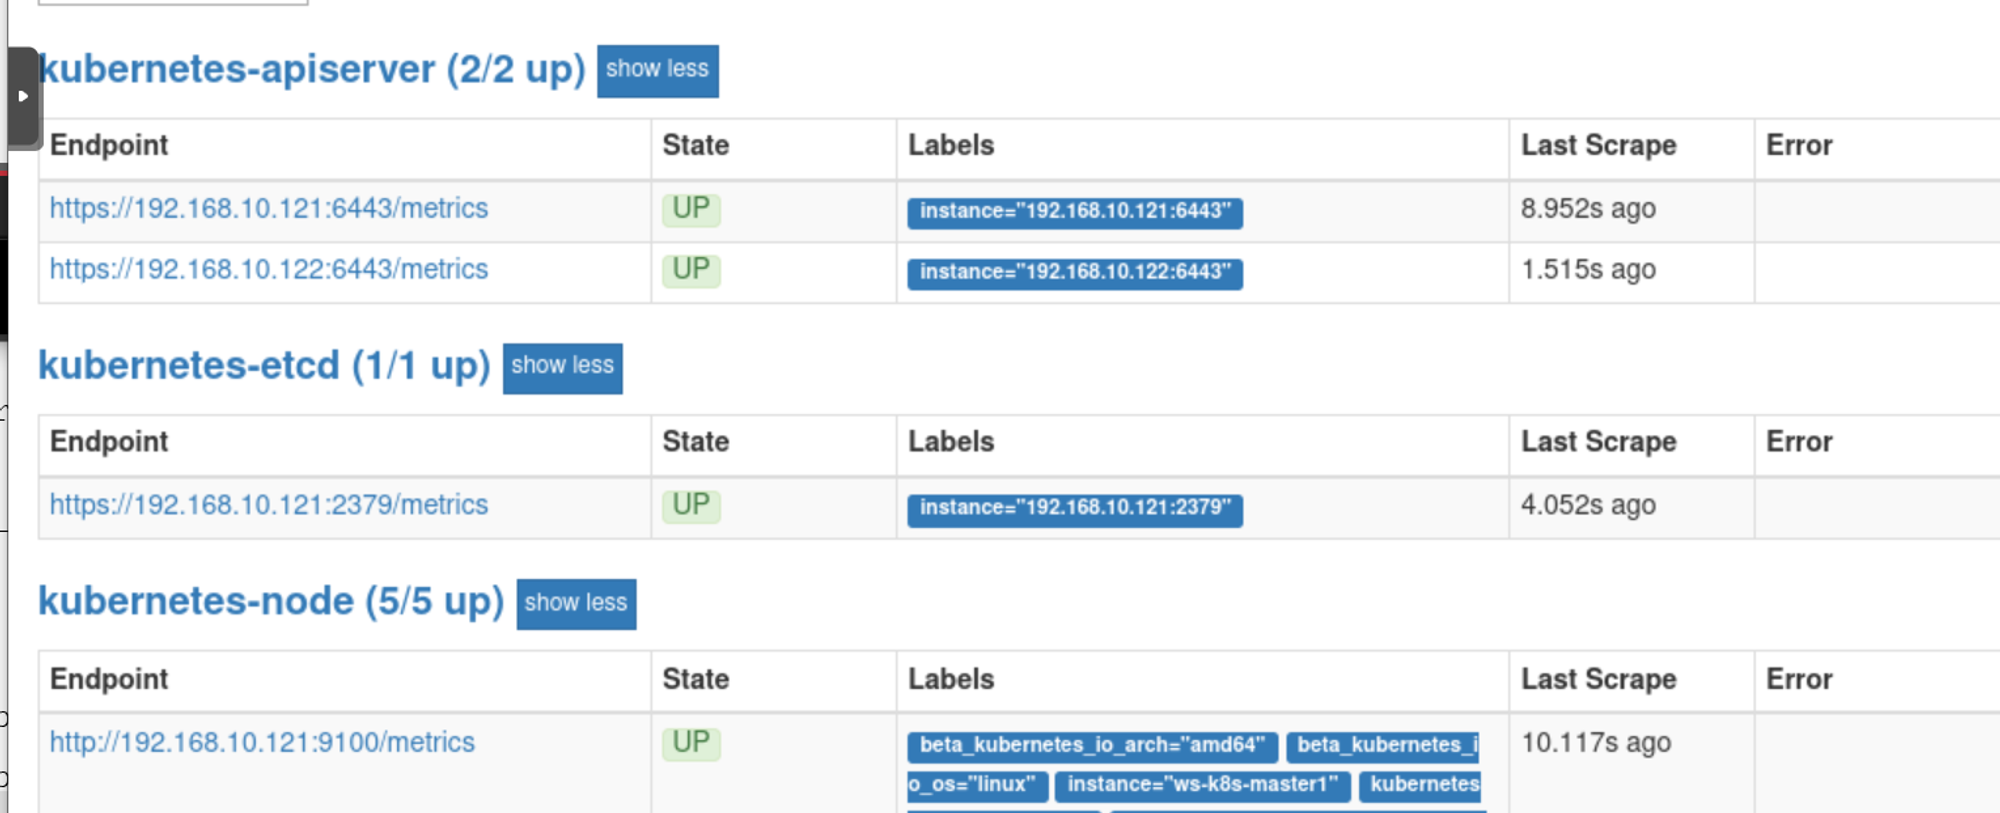
在cfg中添加的job_name就会被添加到targets中
安装kube-state-metrics组件 kube-state-metrics通过监听API Server生成有关资源对象的状态指标,比如Node、Pod,但只是简单的提供一个metrics数据,并不会存储这些指标数据,所以我们可以使用Prometheus来抓取这些数据然后存储,主要关注的是业务相关的元数据,比如Pod副本状态等;调度了多少个replicas?现在可用的有几个?多少个Pod是running/stopped/terminated状态?Pod重启了多少次等
所需镜像: kube-state-metrics_1_9_0
1
2
3
4
5
6
7
8
9
10
11
12
13
14
15
16
17
18
19
20
21
22
23
24
25
26
27
28
29
30
31
32
33
34
35
36
37
38
39
40
41
42
43
44
45
46
47
48
49
50
51
52
53
54
55
56
57
58
59
60
61
62
63
64
65
66
67
68
69
70
71
72
73
74
75
76
77
78
79
80
81
82
83
84
85
deployment: --- apiVersion: apps/v1 kind: Deployment metadata: name: kube-state-metrics namespace: kube-system spec: replicas: 1 selector: matchLabels: app: kube-state-metrics template: metadata: labels: app: kube-state-metrics spec: serviceAccountName: kube-state-metrics containers: - name: kube-state-metrics image: quay.io/coreos/kube-state-metrics:v1.9.0 imagePullPolicy: IfNotPresent ports: - containerPort: 8080 rbac: --- apiVersion: v1 kind: ServiceAccount metadata: name: kube-state-metrics namespace: kube-system --- apiVersion: rbac.authorization.k8s.io/v1 kind: ClusterRole metadata: name: kube-state-metrics rules: - apiGroups: ["" ] resources: ["nodes" , "pods" , "services" , "resourcequotas" , "replicationcontrollers" , "limitranges" , "persistentvolumeclaims" , "persistentvolumes" , "namespaces" , "endpoints" ] verbs: ["list" , "watch" ] - apiGroups: ["extensions" ] resources: ["daemonsets" , "deployments" , "replicasets" ] verbs: ["list" , "watch" ] - apiGroups: ["apps" ] resources: ["statefulsets" ] verbs: ["list" , "watch" ] - apiGroups: ["batch" ] resources: ["cronjobs" , "jobs" ] verbs: ["list" , "watch" ] - apiGroups: ["autoscaling" ] resources: ["horizontalpodautoscalers" ] verbs: ["list" , "watch" ] --- apiVersion: rbac.authorization.k8s.io/v1 kind: ClusterRoleBinding metadata: name: kube-state-metrics roleRef: apiGroup: rbac.authorization.k8s.io kind: ClusterRole name: kube-state-metrics subjects: - kind: ServiceAccount name: kube-state-metrics namespace: kube-system svc: --- apiVersion: v1 kind: Service metadata: annotations: prometheus.io/scrape: 'true' name: kube-state-metrics namespace: kube-system labels: app: kube-state-metrics spec: ports: port: 8080 protocol: TCP selector: app: kube-state-metrics
1
2
3
4
5
6
7
8
9
10
11
12
13
scp kube-state-metrics_1_9_0.tar.gz ws-k8s-node1:~ scp kube-state-metrics_1_9_0.tar.gz ws-k8s-node2:~ scp kube-state-metrics_1_9_0.tar.gz ws-k8s-node3:~ ctr -n=k8s.io images import kube-state-metrics_1_9_0.tar.gz kubectl apply -f kube-state-metrics-rbac.yaml kubectl apply -f kube-state-metrics-deploy.yaml kubectl apply -f kube-state-metrics-svc.yaml get svc -n kube-system NAME TYPE CLUSTER-IP EXTERNAL-IP PORT(S) AGE kube-state-metrics ClusterIP 10.100.32.230 <none> 8080/TCP 3h4m
Prometheus的热加载 前提是config里添加了 --web recycle选项
1
2
3
4
5
6
7
8
9
10
11
12
13
14
15
16
17
18
19
20
21
22
23
24
25
26
27
28
29
30
31
32
33
34
apiVersion: v1 kind: Service metadata: annotations: prometheus.io/scrape: "true" prometheus.io/port: "9090" name: prometheus namespace: monitor-sa labels: app: prometheus spec: type : NodePort ports: - port: 9090 targetPort: 9090 protocol: TCP selector: app: prometheus component: server 将 prometheus.io/scrape: "true" prometheus.io/port: "9090" 删掉后使用 kubectl apply -f prometheus-svc.yaml kubectl get svc -n monitor-sa NAME TYPE CLUSTER-IP EXTERNAL-IP PORT(S) AGE prometheus NodePort 10.101.15.38 <none> 9090:31427/TCP 147m curl -X POST http://10.101.15.38:9090/-/reload curl -X POST http://10.100.243.200:9090/-/reload 立即生效,不影响正常运行
Prometheus数据类型 counter计数器 用于累计值,只会增加,不会减少,比如记录请求次数
重启进程后会重置
例如:
Gauge测量器 常规值,可变大可变小
例如:
histogram柱状图 在查询语言中有三种作用
1.在一段时间内对数据进行采样,后续通过指定区间进行筛选,也可以统计样本总数,最后展示为直方图
如果定义一个度量类型为histogram,就会自动生成三个对应的指标
在大多数情况下人们都倾向于使用某些量化指标的平均值,例如 CPU 的平均使用率、页面的平均响应时间。这种方式的问题很明显,以系统 API 调用的平均响应时间为例:如果大多数 API 请求都维持在 100ms 的响应时间范围内,而个别请求的响应时间需要 5s,那么就会导致某些 WEB 页面的响应时间落到中位数的情况,而这种现象被称为长尾问题。
要解决这个问题,最简单的方式就是按照请求延迟的范围进行分组。例如,统计延迟在 010ms 之间的请求数有多少,而 1020ms 之间的请求数又有多少。通过这种方式可以快速分析系统慢的原因。Histogram 和 Summary 都是为了能够解决这样问题的存在,通过 Histogram 和 Summary 类型的监控指标,我们可以快速了解监控样本的分布情况。
Histogram 类型的样本会提供三种指标(假设指标名称为 ):_bucket{le=”<上边界>”}。解释的更通俗易懂一点,这个值表示指标值小于等于上边界的所有样本数量。
1、http 请求响应时间 <=0.005 秒 的请求次数为0
所有样本值的大小总和,命名为 _sum。
summary 与histogrm类似,用于表示一段时间内的数据采样结果(通常是请求持续时间或响应大小等),但它直接存储了分位数
它也有三种作用:
样本值的分位数分布情况,命名为 {quantile=”<φ>”}。_sum。
样本总数,命名为 _count。
PromQL查询语言 用以对时序数据进行查找和筛选
PromQL 表达式计算出来的值有以下几种类型:
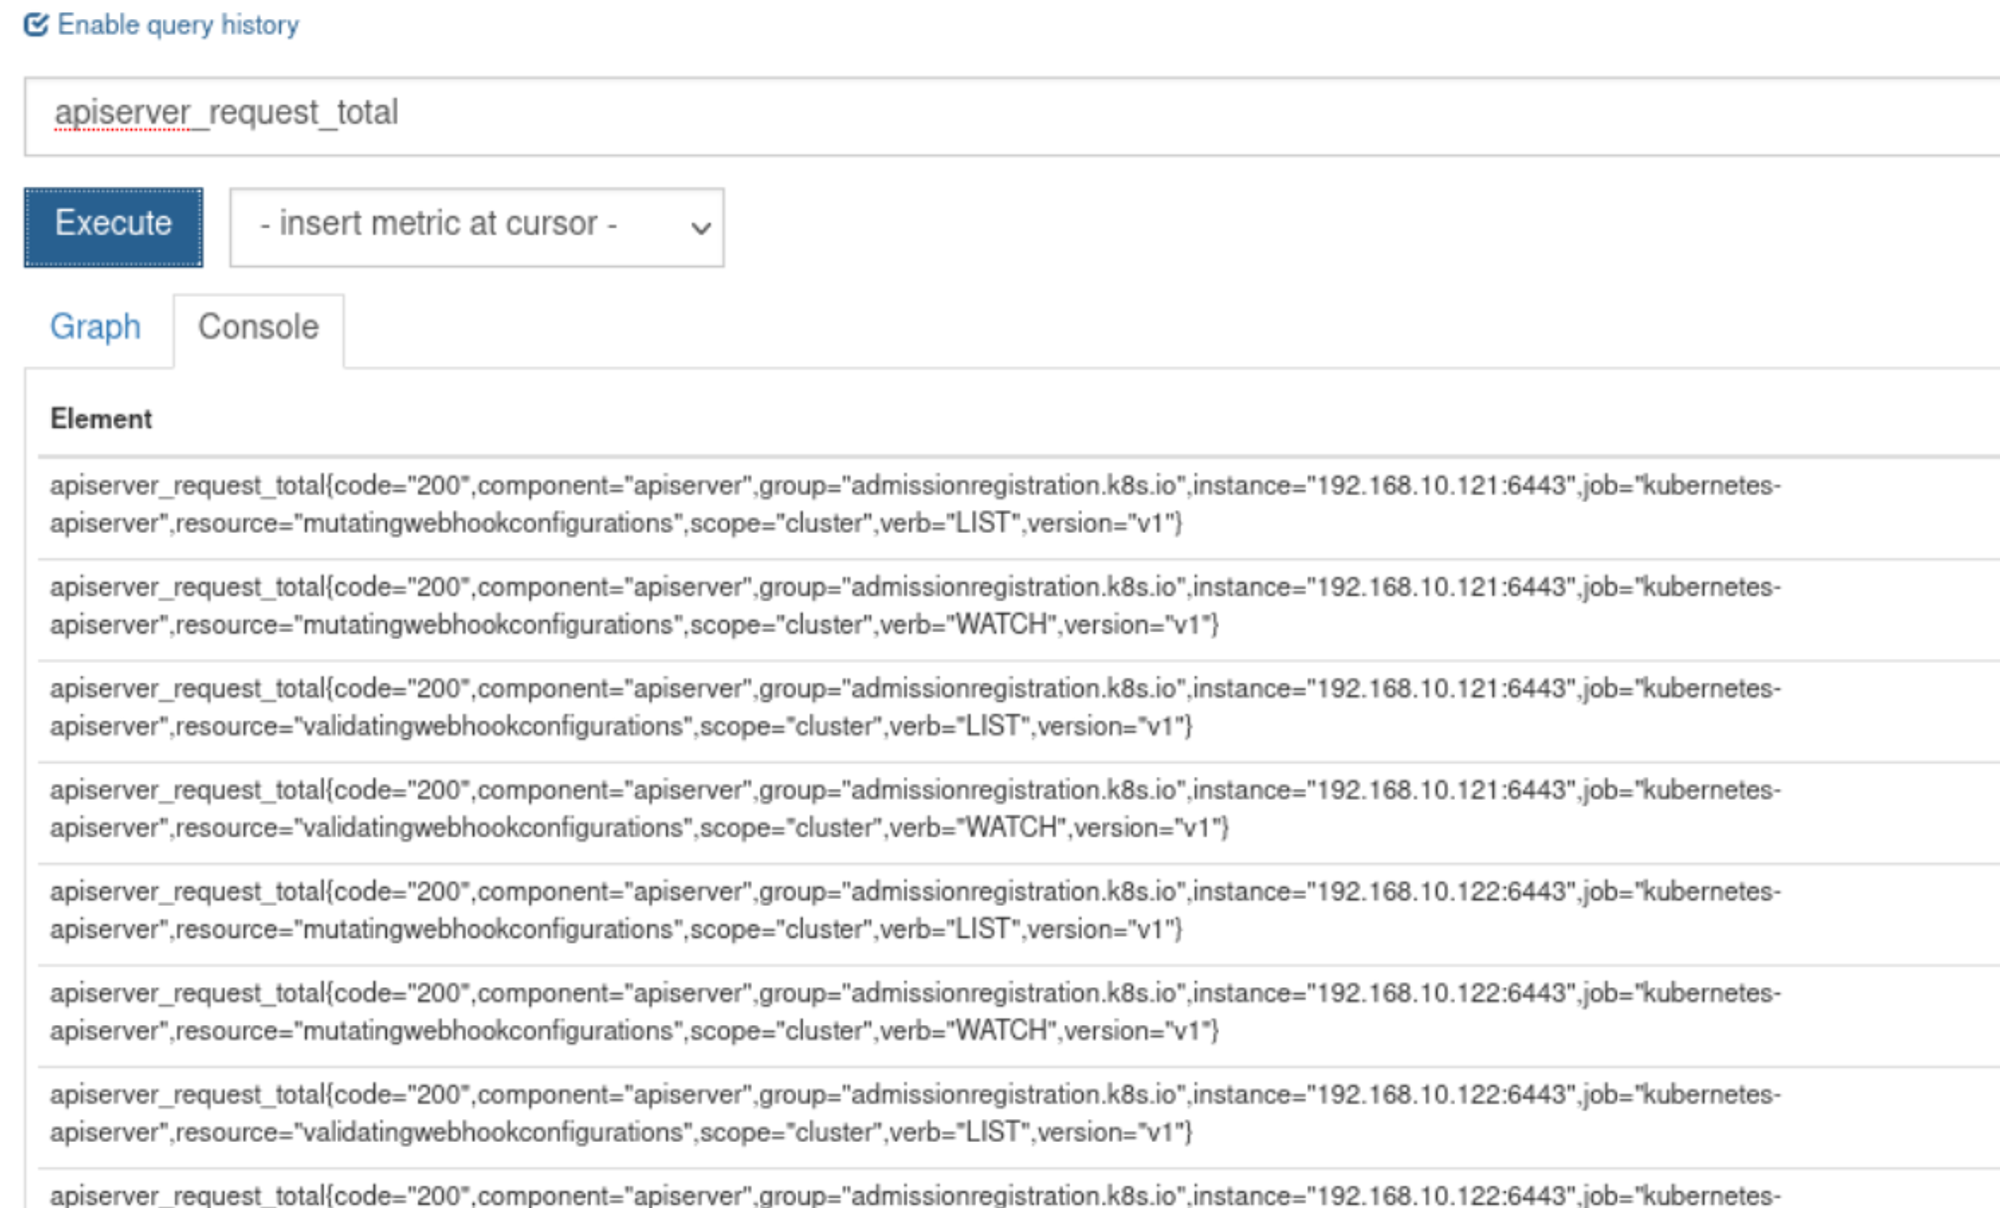
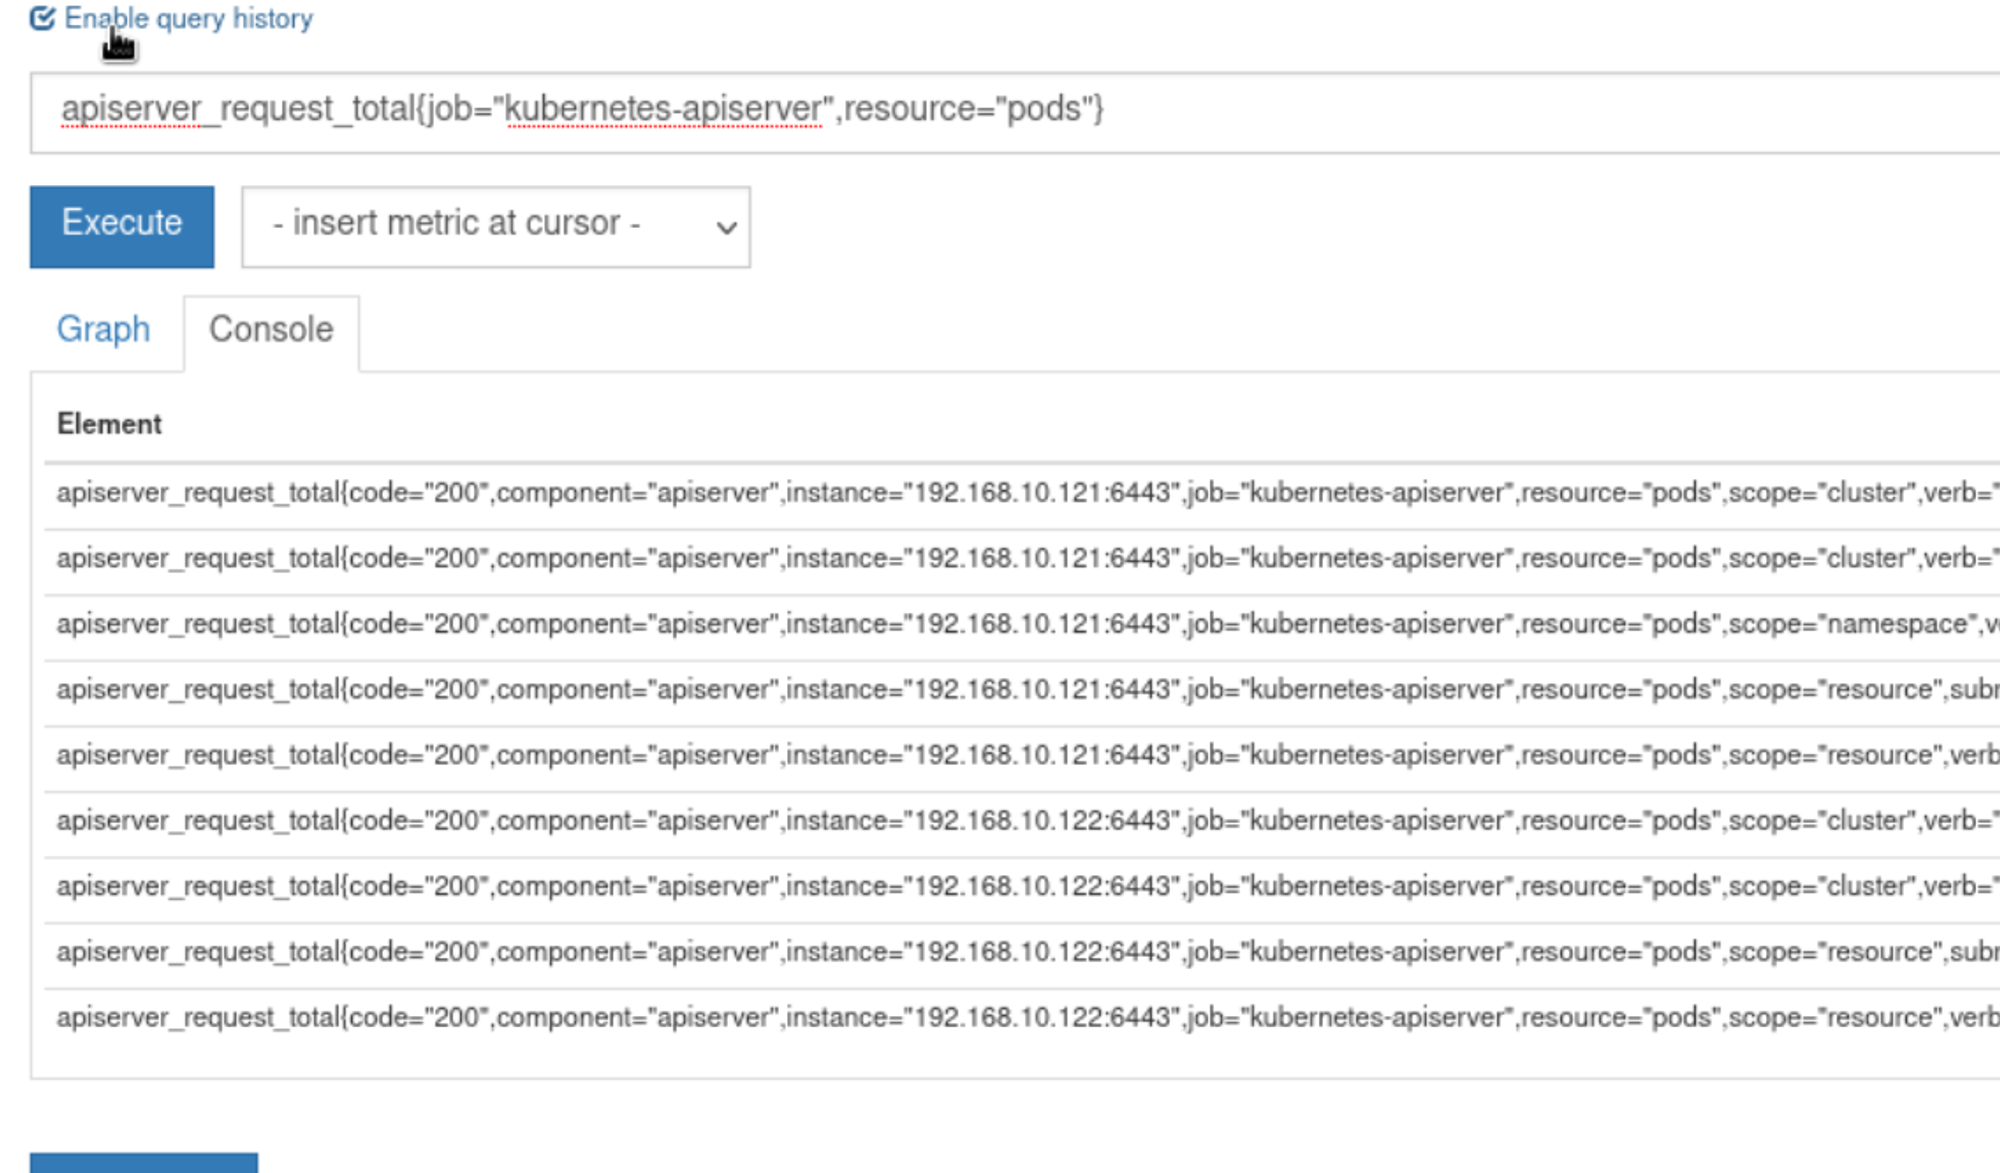
瞬时向量 用在Prometheus的UI界面进行查找
如apiserver_request_total
可以在查询语句后添加大括号,在其中进行筛选条件apiserver_request_total{job="kubernetes-apiserver",resource="pods"}
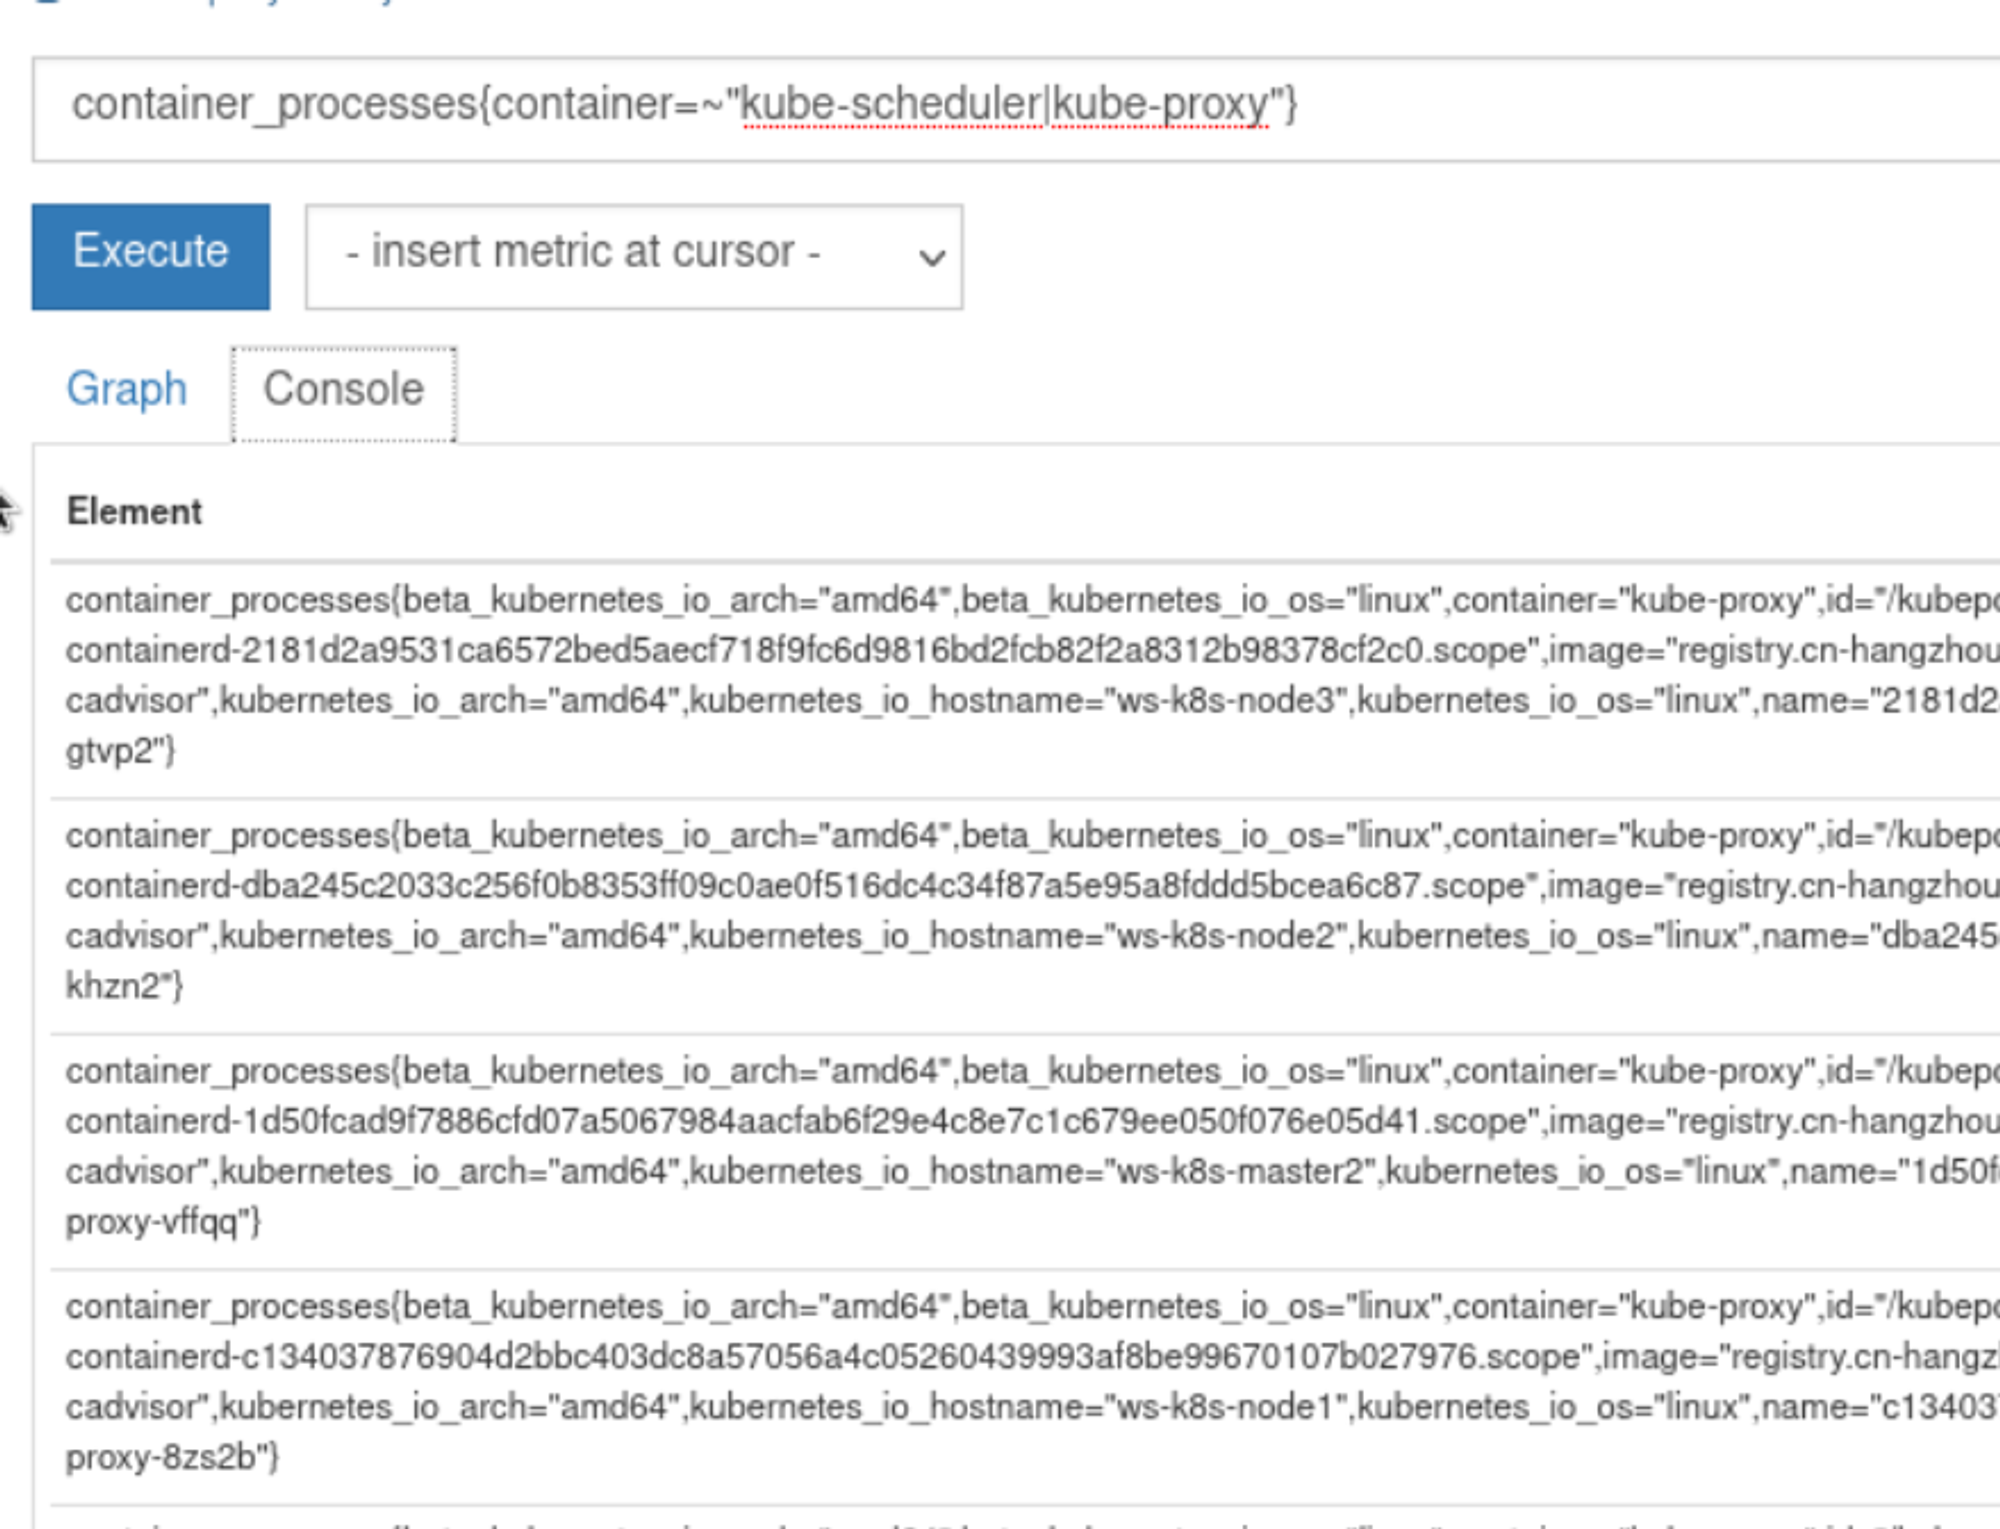
支持使用正则进行匹配:: 正则表达式匹配: 正则表达式不匹配container_processes{container=~"kube-scheduler|kube-proxy"}
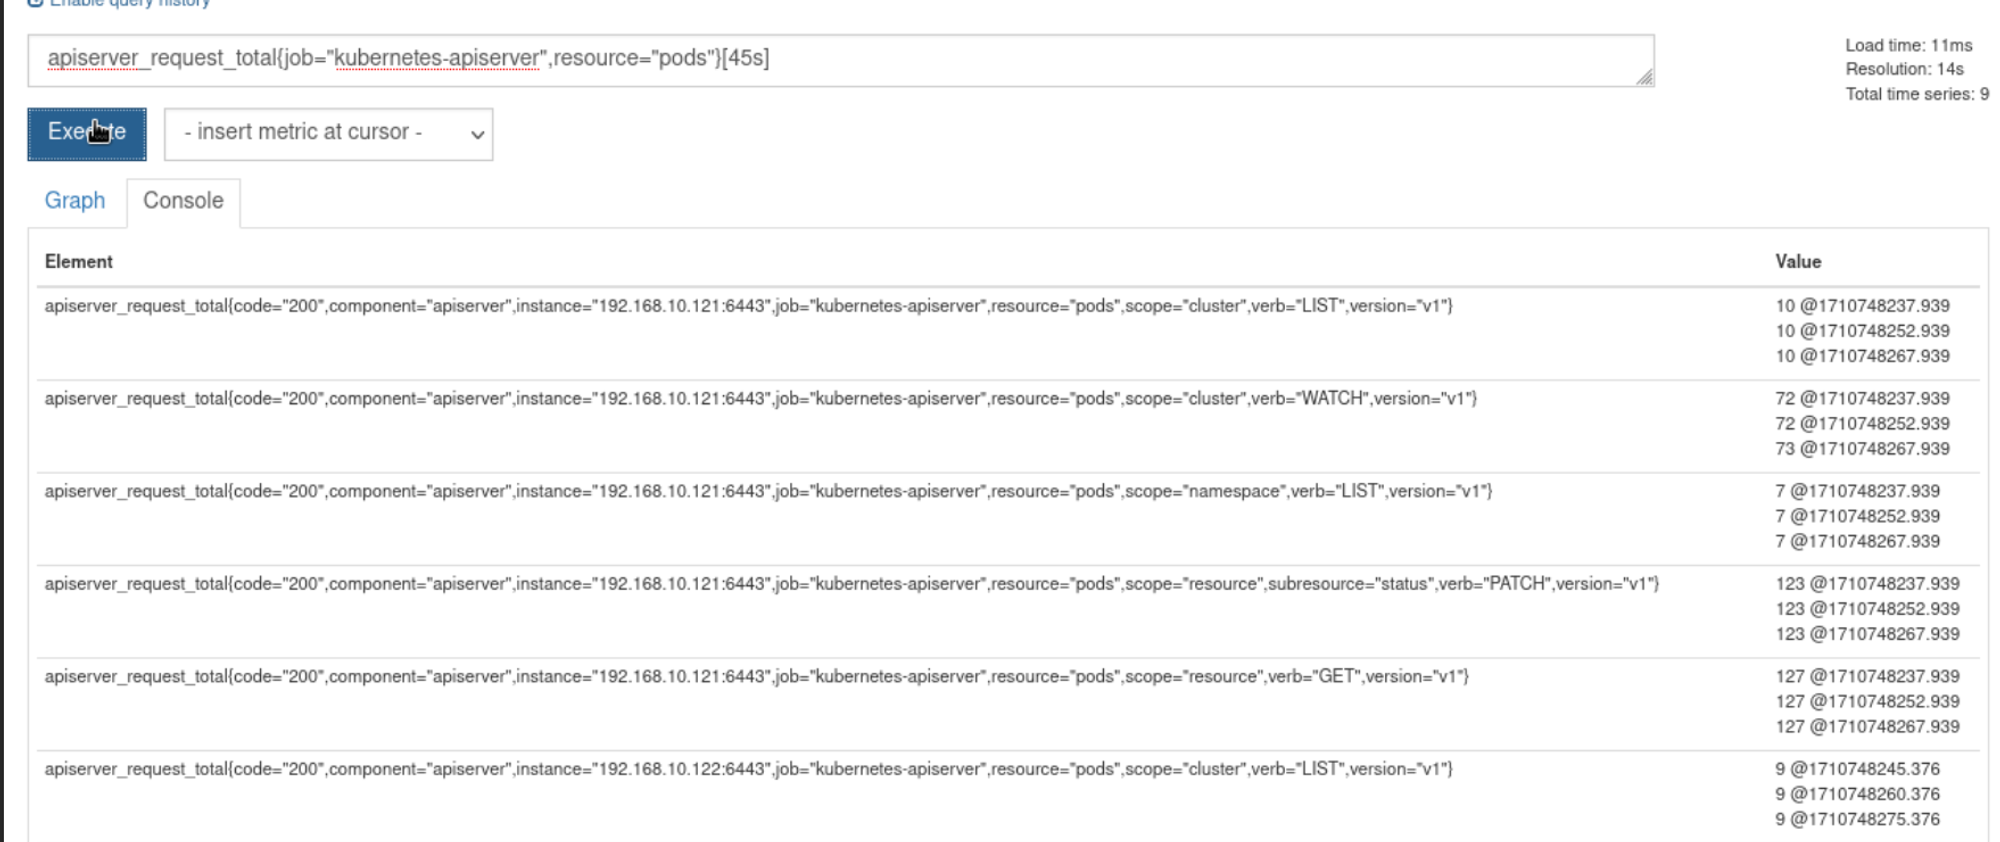
区间向量 区间向量选择就是在瞬时向量的基础上加上方括号[]apiserver_request_total{job="kubernetes-apiserver",resource="pods"}[1m]
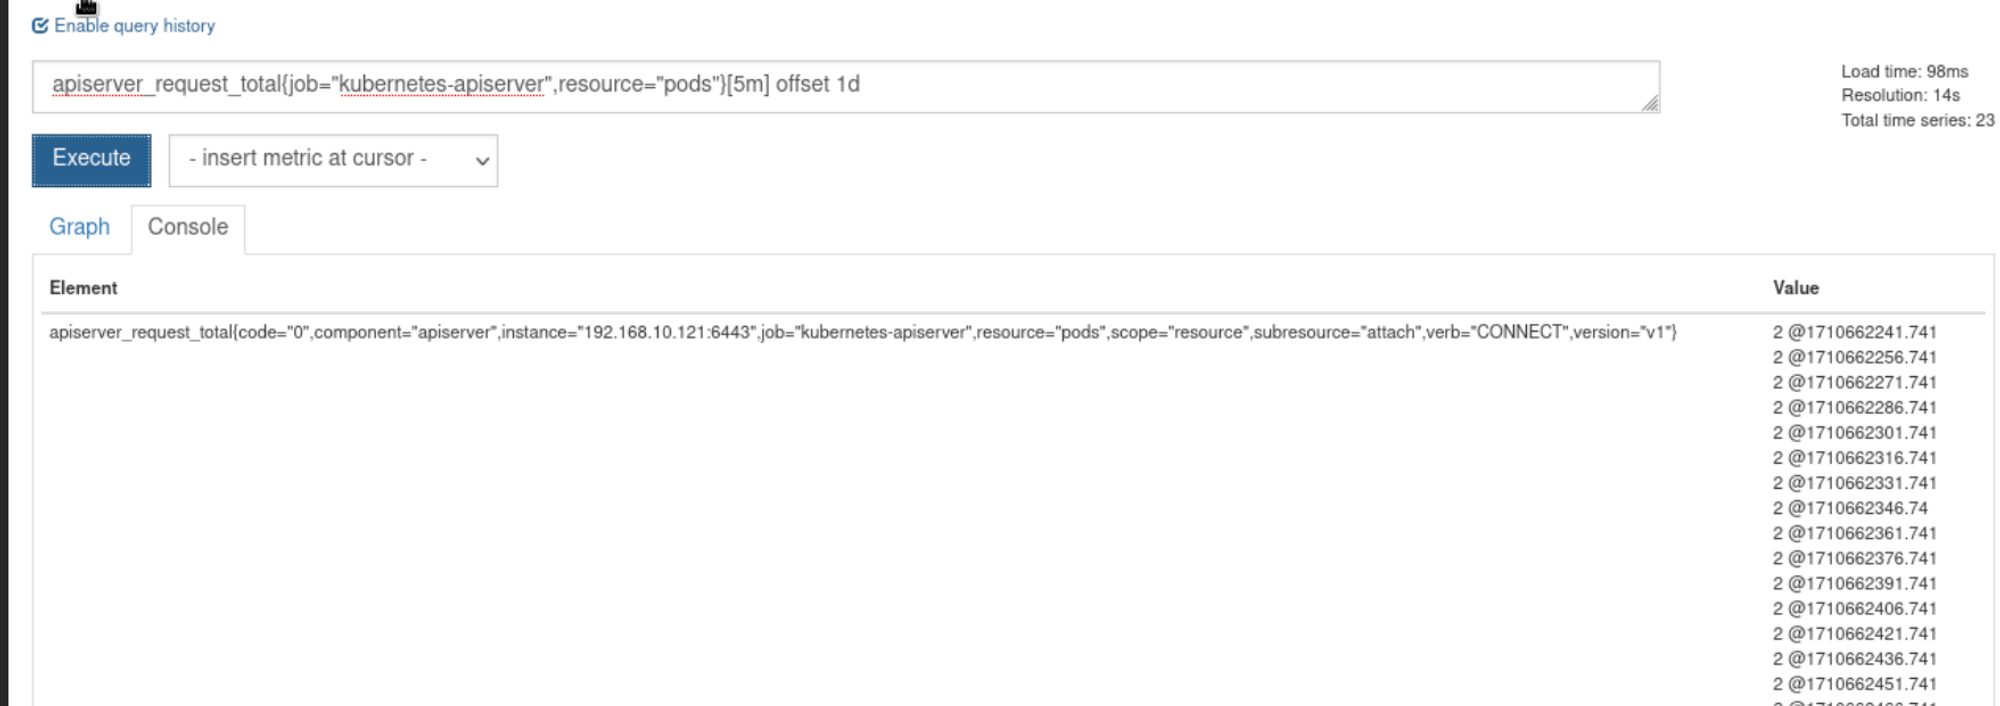
偏移向量选择器 前两种都是以当前时间为基准时间,偏移向量选择器可以调整基础时间,可以查询之前的时间区间
五分钟之前的采样apiserver_request_total{job="kubernetes-apiserver",resource="pods"}offset 5m
一周(week)前的这个时间点过去五分钟的采样apiserver_request_total{job="kubernetes-apiserver",resource="pods"}[5m] offset 1w
聚合操作符与函数 PromQL用来将向量里的元素聚合的更少
1 2 3 4 5 6 7 8 9 10 11 12 13 14 15 16 17 18 19 20 21 22 23 sum max min avg stddev 标准差 stdvar 方差 count 元素个数 count——values 等于某值的元素个数 bottomk 最小的k个元素 topk 最大的k个元素 quantile 分位数 abs():绝对值 sqrt():平方根 exp():指数计算 ln ():自然对数ceil():向上取整 floor():向下取整 round():四舍五入取整 delta():计算区间向量里每一个时序第一个和最后一个的差值 sort ():排序
例子:
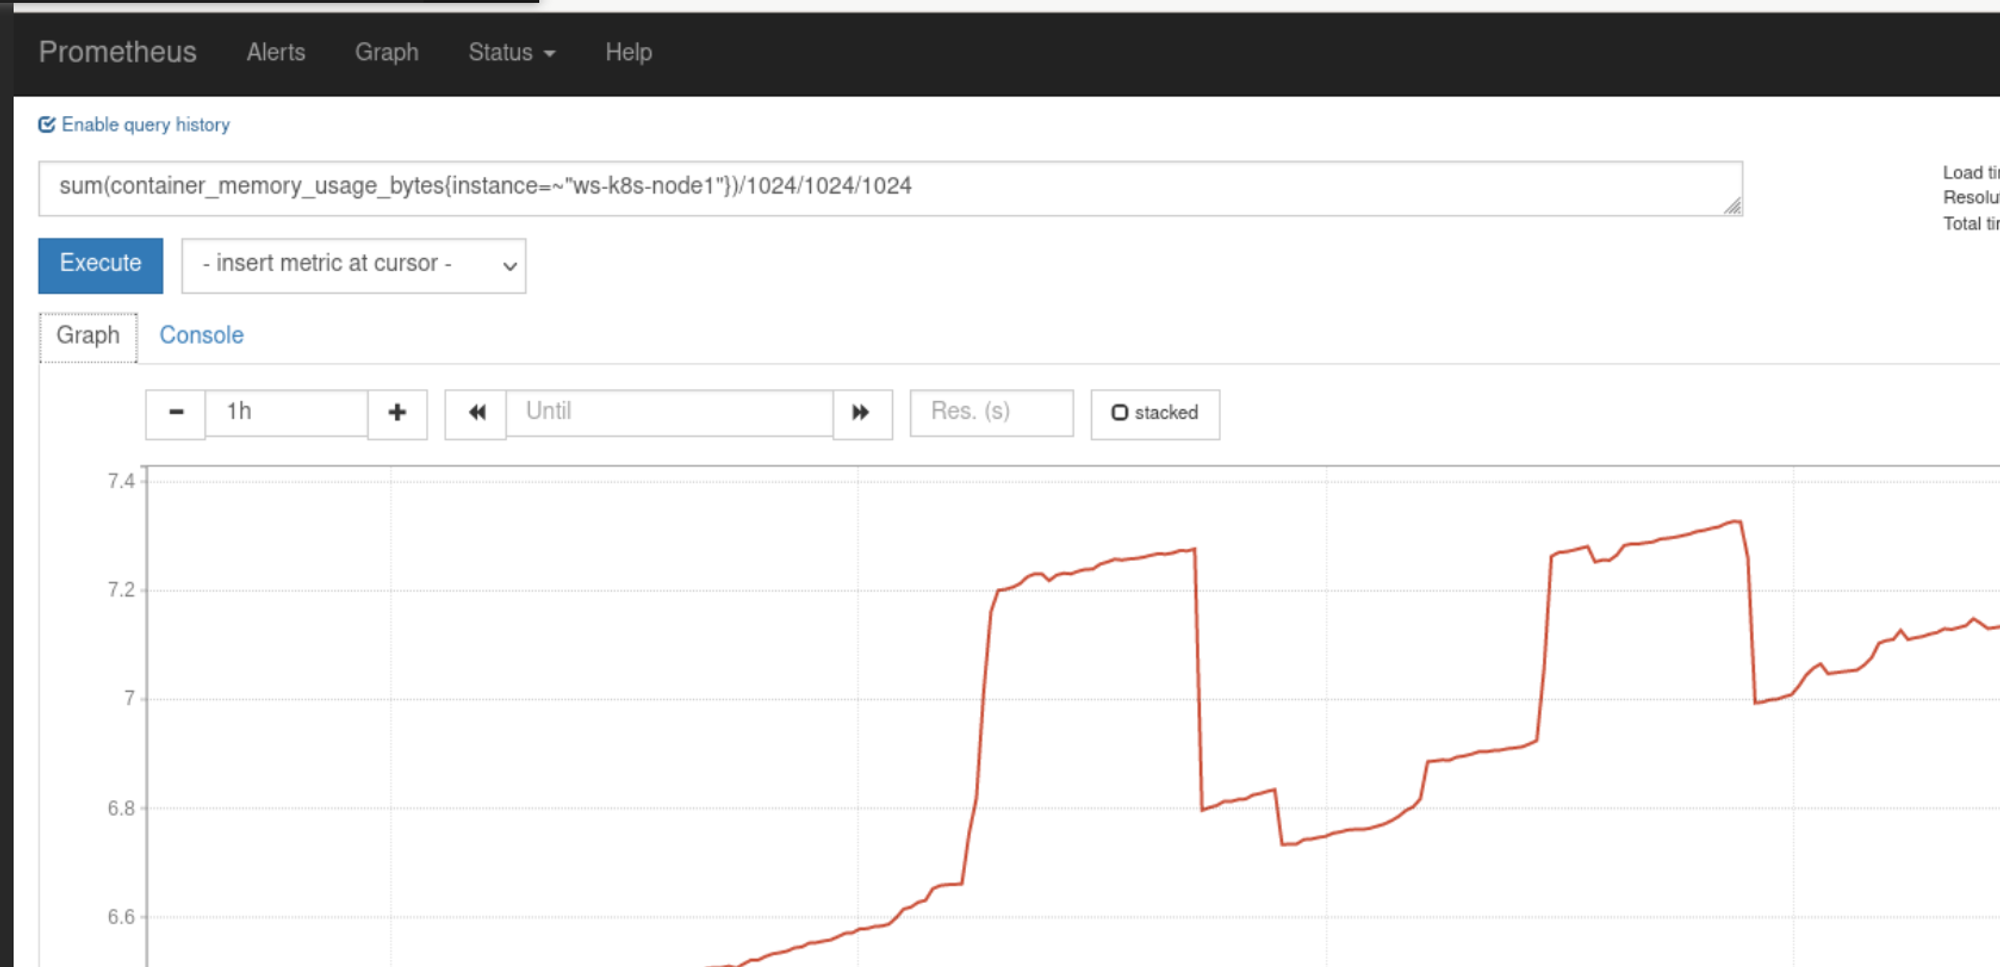
查找node1使用的内存综合:
计算节点最近1m所有容器cpu使用率:“ws-k8s-node1”}[1m])) / sum (machine_cpu_cores{ instance =“ws-k8s-node1”}) * 100
计算最近1m所有容器cpu使用率(用ID进行分组):
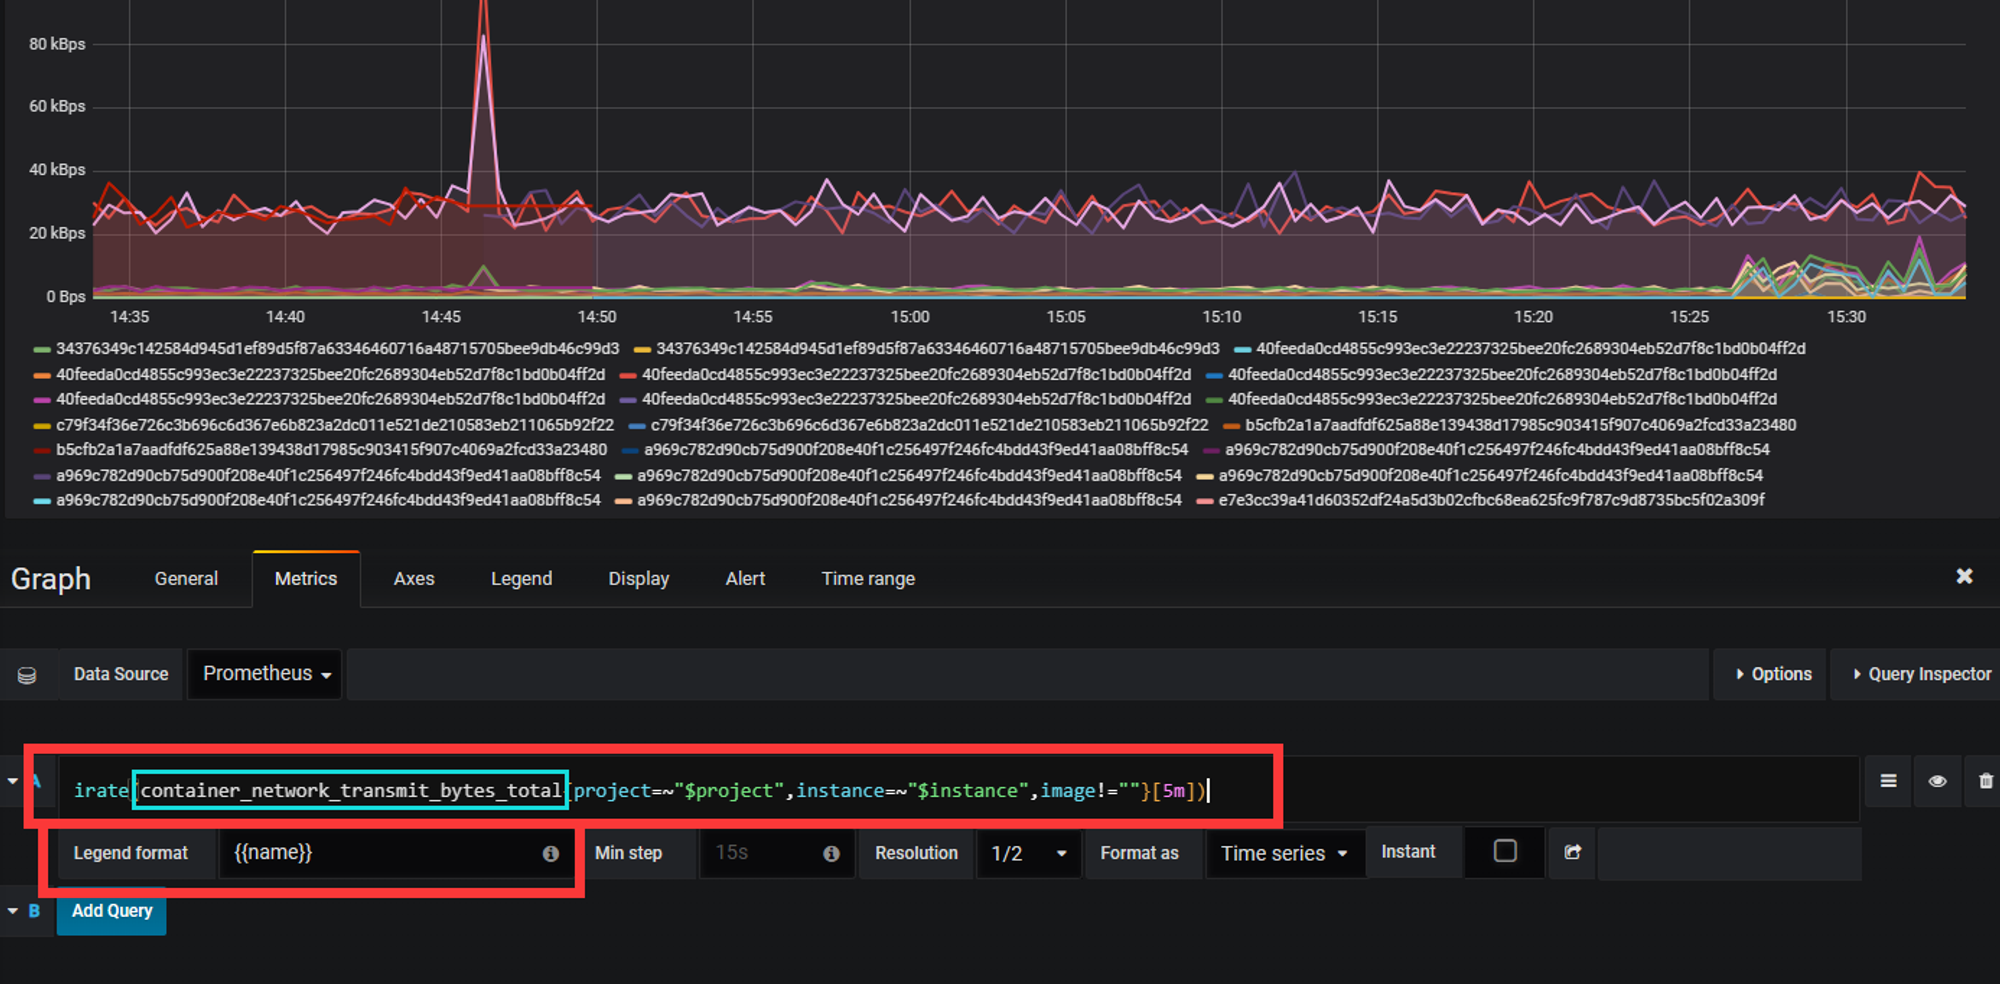
Grafana可视化界面安装与接入 grafana版本v5.0.4
json下载地址 https://grafana.com/dashboards?dataSource=prometheus&search=kubernetes
Grafana是一个跨平台的开源的度量分析和可视化工具,可以将采集的数据可视化的展示,并及时通知给告警接收方。它主要有以下六大特点:
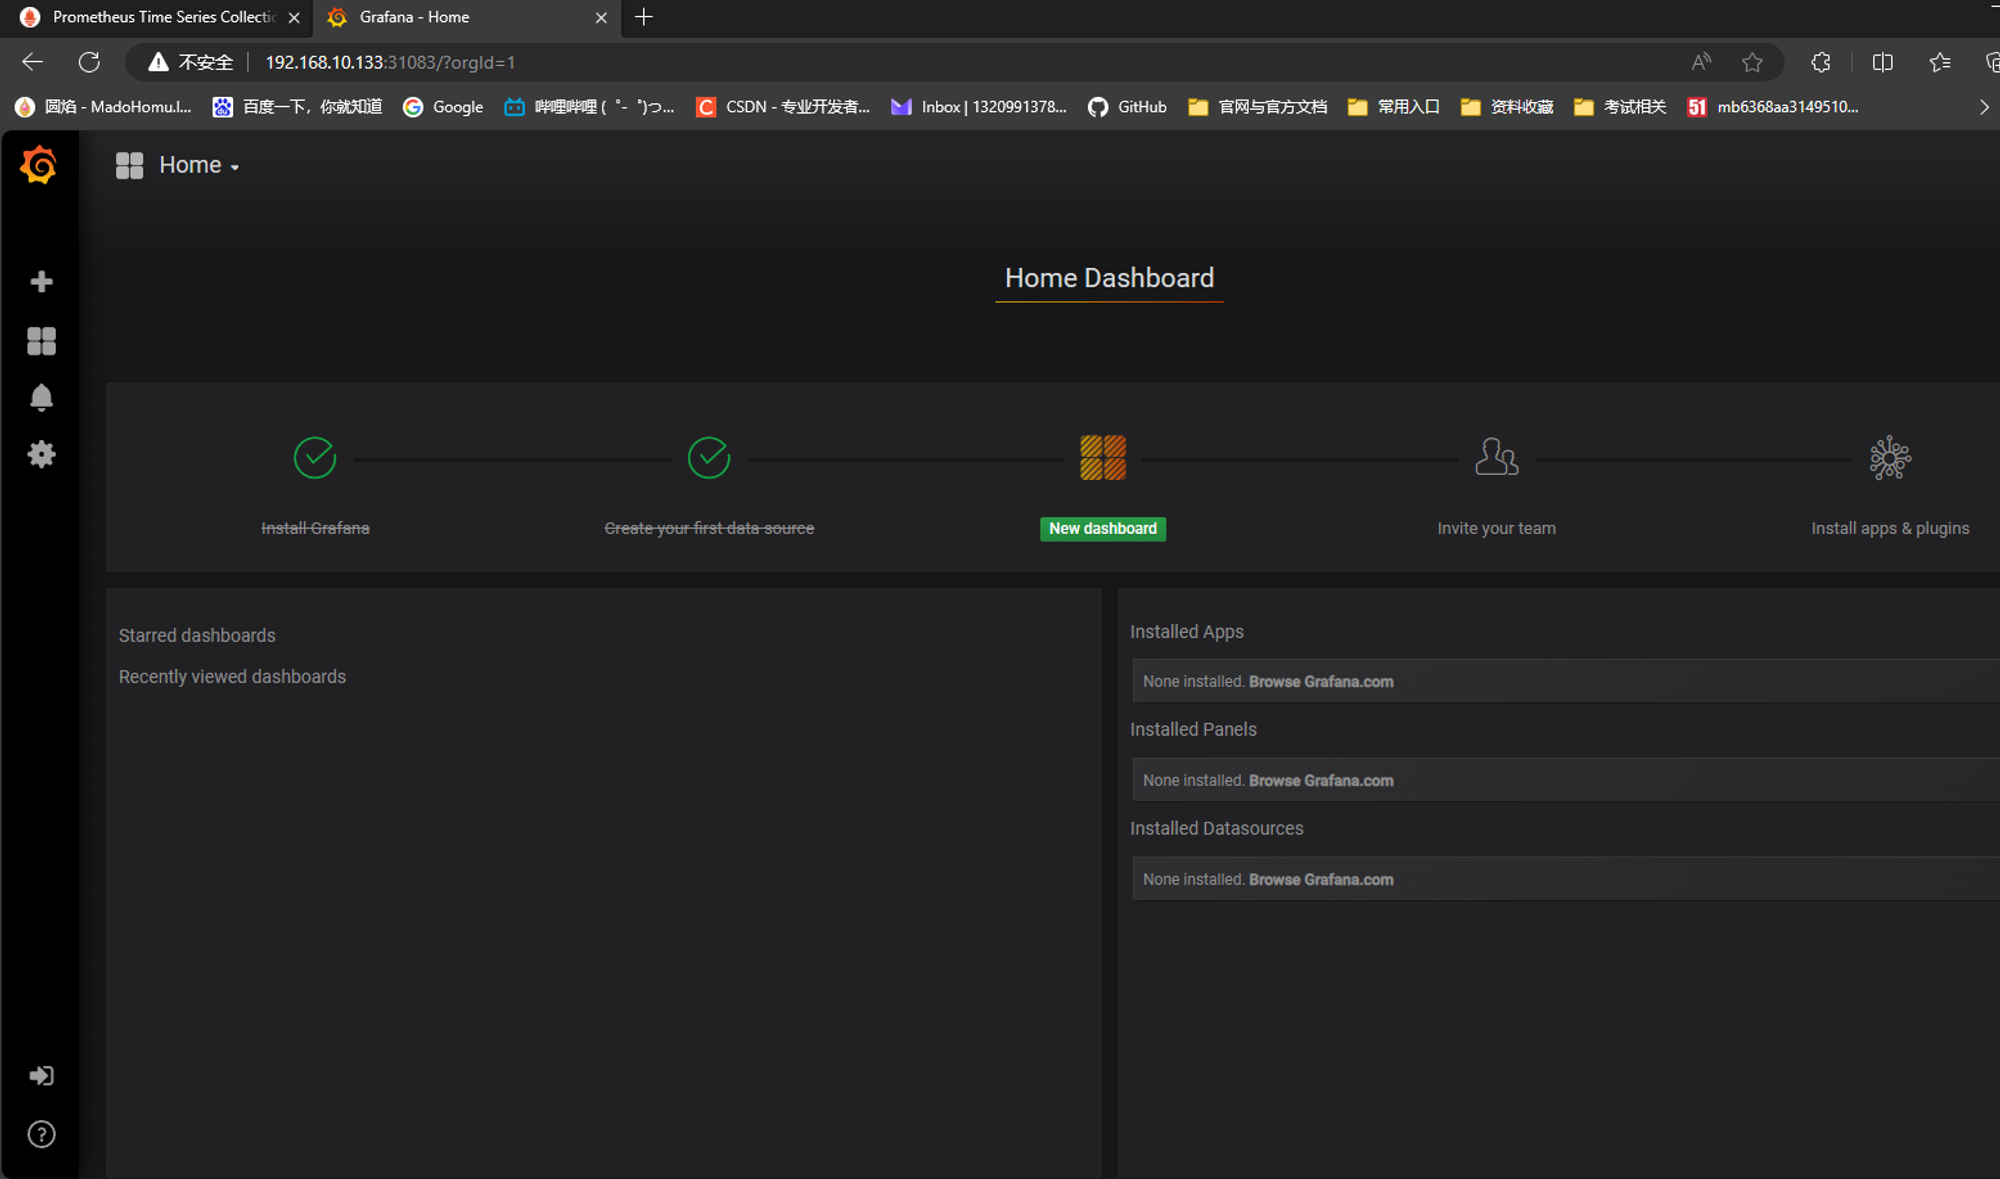
1
2
3
4
5
6
7
8
9
10
11
12
13
14
15
16
17
18
19
20
21
22
23
24
25
26
27
28
29
30
31
32
33
34
35
36
37
38
39
40
41
42
43
44
45
46
47
48
49
50
51
52
53
54
55
上传heapster-grafana-amd64_v5_0_4.tar.gz到node ctr -n=k8s.io images import heapster-grafana-amd64_v5_0_4.tar.gz apiVersion: apps/v1 kind: Deployment metadata: name: monitoring-grafana namespace: kube-system spec: replicas: 1 selector: matchLabels: task: monitoring k8s-app: grafana template: metadata: labels: task: monitoring k8s-app: grafana spec: containers: - name: grafana image: k8s.gcr.io/heapster-grafana-amd64:v5.0.4 imagePullPolicy: IfNotPresent ports: - containerPort: 3000 protocol: TCP volumeMounts: - mountPath: /etc/ssl/certs name: ca-certificates readOnly: true - mountPath: /var name: grafana-storage env : - name: INFLUXDB_HOST value: monitoring-influxdb - name: GF_SERVER_HTTP_PORT value: "3000" kubectl apply -f grafana.yaml kubectl get pods -n kube-system -owide | grep monitor monitoring-grafana-65bb7f7f84-tk2ps 1/1 Running 0 21s 10.244.193.133 ws-k8s-node3 <none> <none> kubectl get svc -n kube-system | grep moni monitoring-grafana NodePort 10.110.11.84 <none> 80:31083/TCP 60s 浏览器访问node ip 192.168.10.121:31083进入
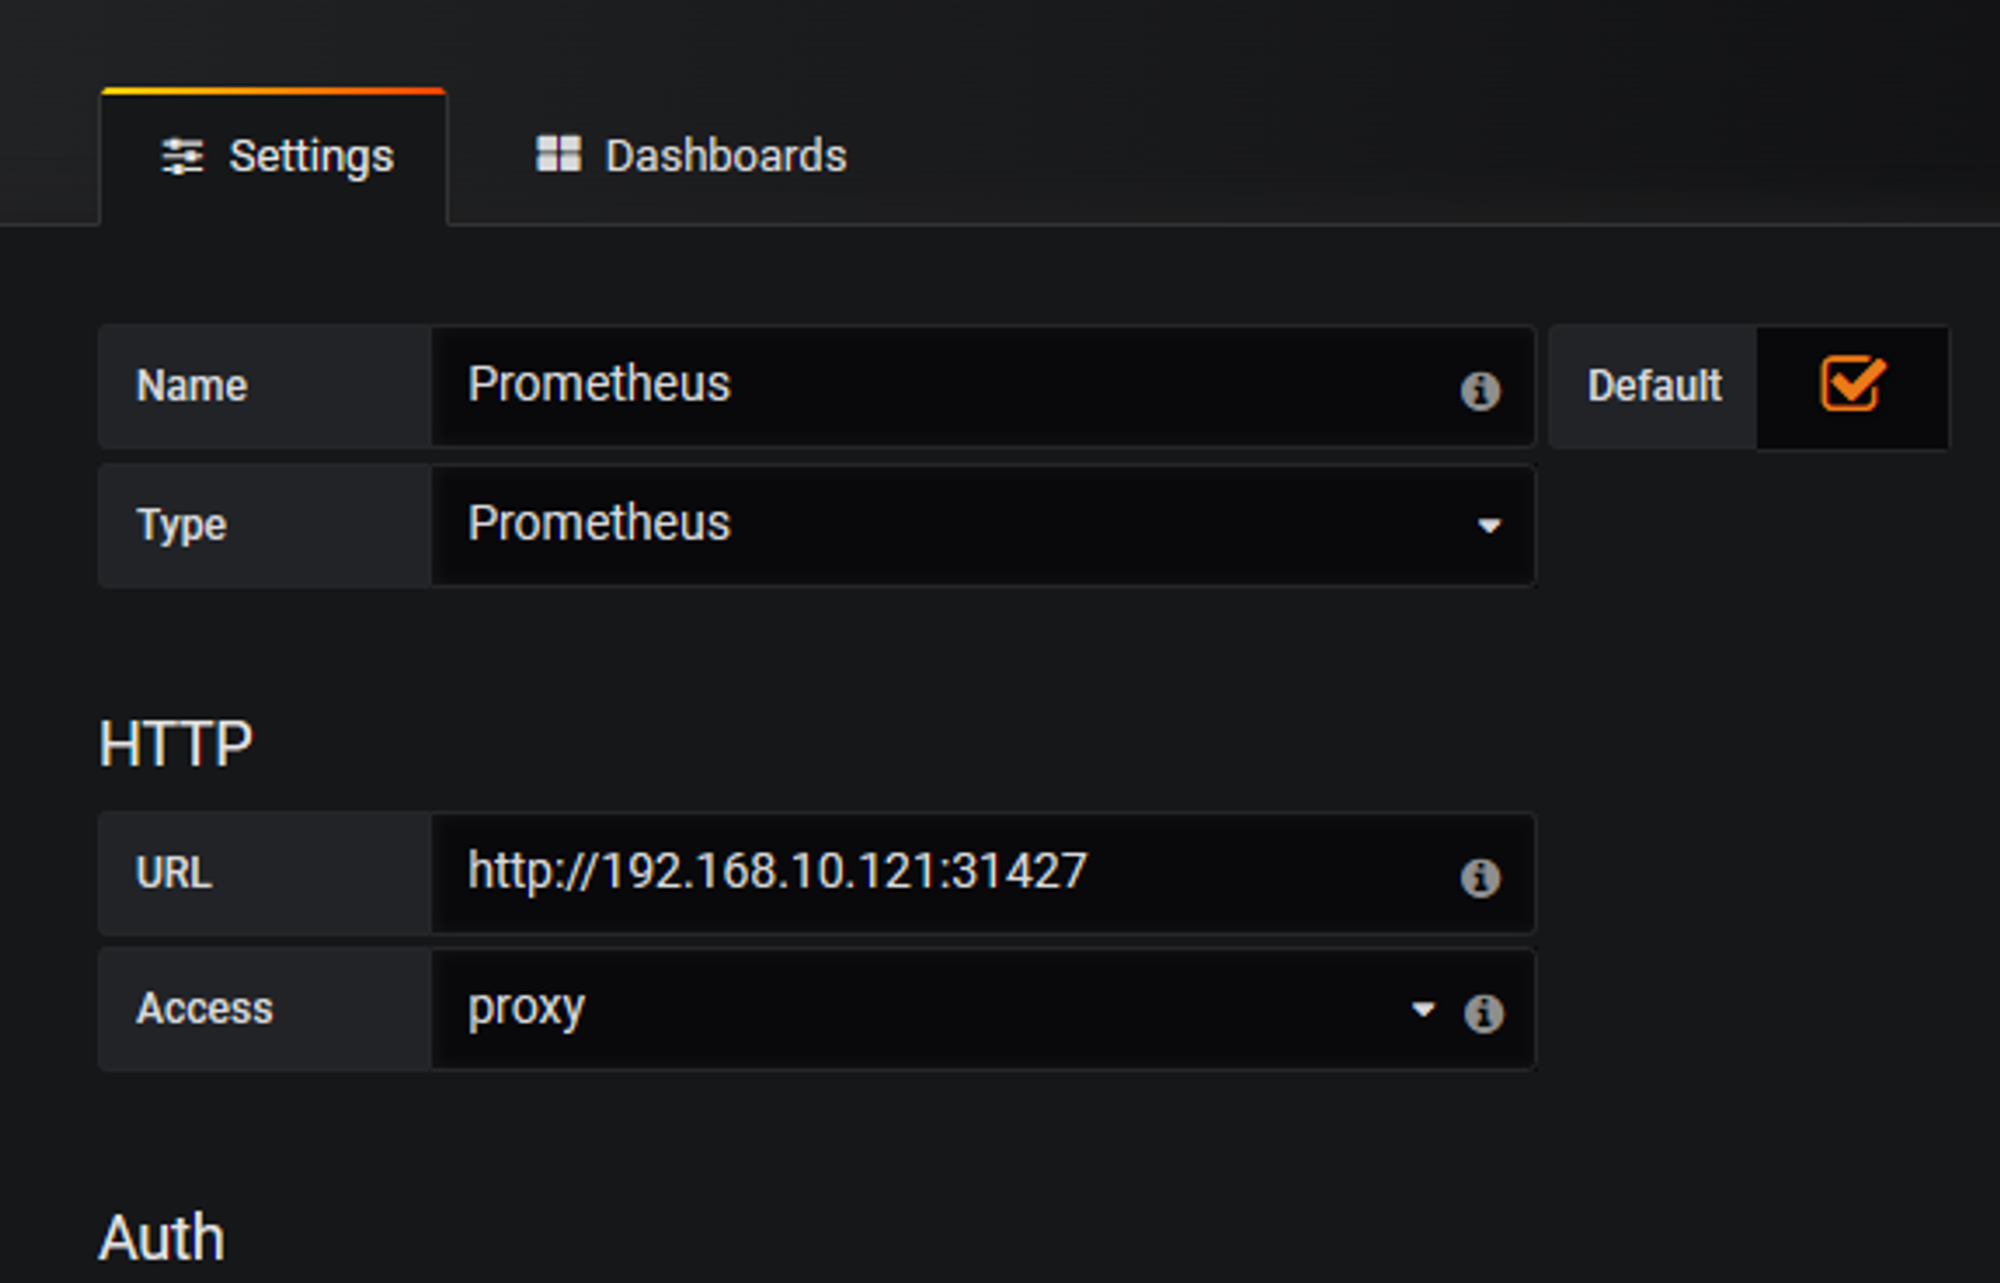
创建数据源
进入import,import网上下载的一些模板json文件
docker_rev1
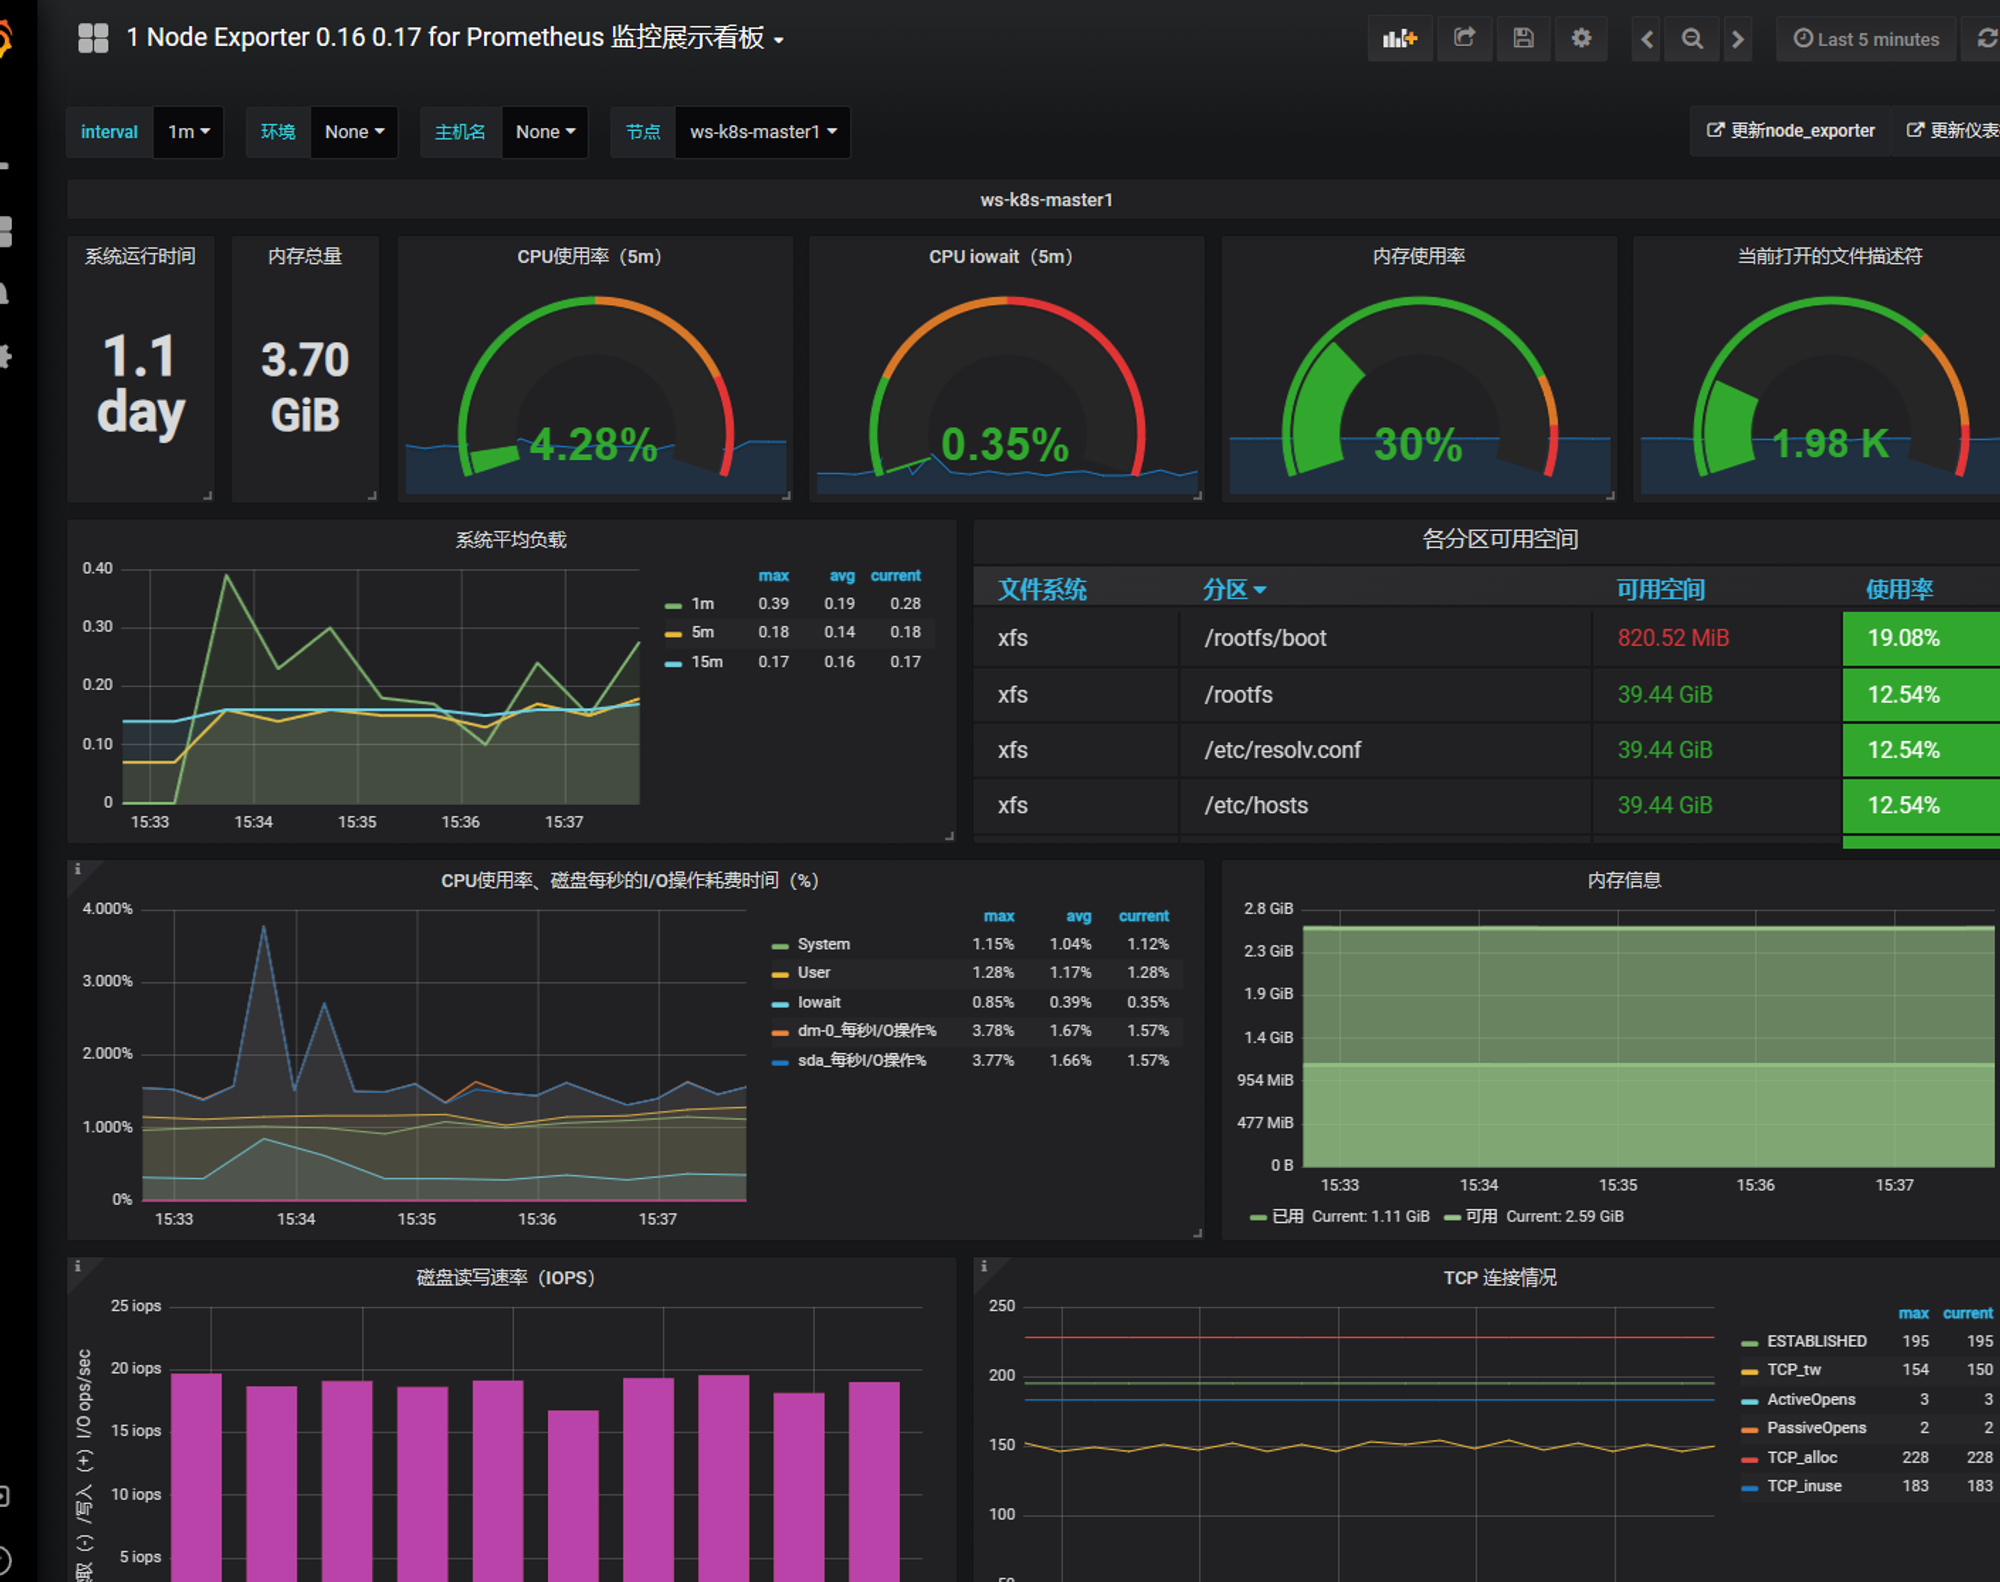
node_exporter.json
Prometheus中每个选项都可以打开进行编辑,其中包含拉取的数据源,显示的选项名
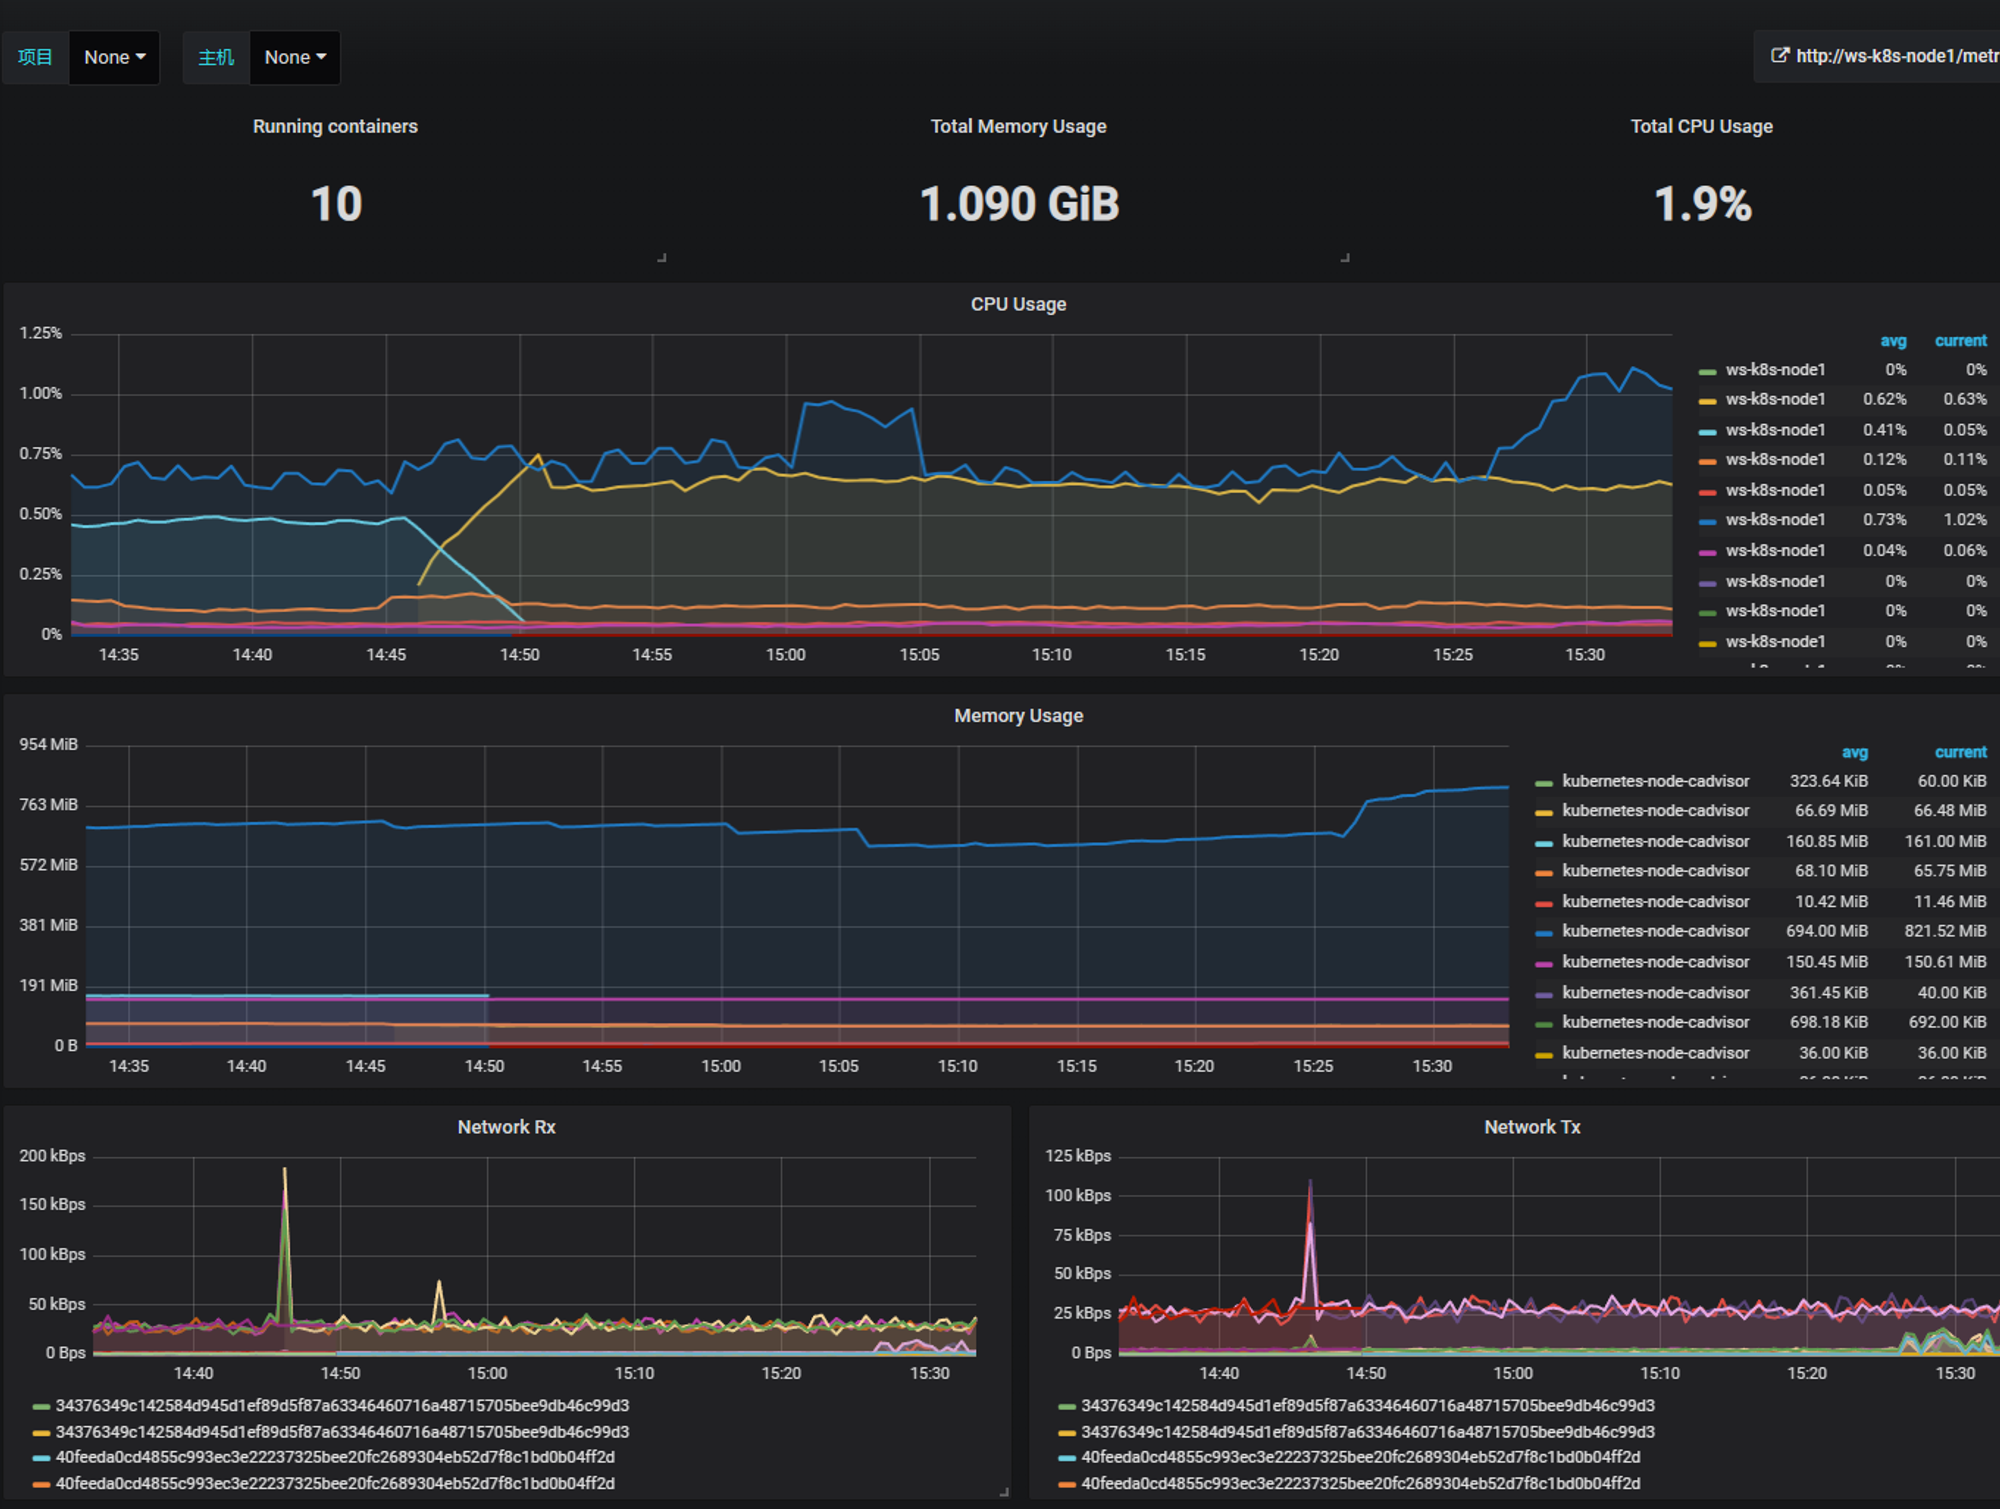
导入node-exporter
导入kube-state-metrics
kube-state-metrics.json
alertmanager告警推送 报警处理流程如下:
Prometheus Server监控目标主机上暴露的http接口(这里假设接口A),通过Promethes配置的’scrape_interval’定义的时间间隔,定期采集目标主机上监控数据。
当接口A不可用的时候,Server端会持续的尝试从接口中取数据,直到”scrape_timeout”时间后停止尝试。这时候把接口的状态变为“DOWN”。
Prometheus同时根据配置的”evaluation_interval”的时间间隔,定期(默认1min)的对Alert Rule进行评估;当到达评估周期的时候,发现接口A为DOWN,即UP=0为真,激活Alert,进入“PENDING”状态,并记录当前active的时间;
当下一个alert rule的评估周期到来的时候,发现UP=0继续为真,然后判断警报Active的时间是否已经超出rule里的‘for’ 持续时间,如果未超出,则进入下一个评估周期;如果时间超出,则alert的状态变为“FIRING”;同时调用Alertmanager接口,发送相关报警数据。
AlertManager收到报警数据后,会将警报信息进行分组,然后根据alertmanager配置的“group_wait”时间先进行等待。等wait时间过后再发送报警信息。
属于同一个Alert Group的警报,在等待的过程中可能进入新的alert,如果之前的报警已经成功发出,那么间隔“group_interval”的时间间隔后再重新发送报警信息。比如配置的是邮件报警,那么同属一个group的报警信息会汇总在一个邮件里进行发送。
如果Alert Group里的警报一直没发生变化并且已经成功发送,等待‘repeat_interval’时间间隔之后再重复发送相同的报警邮件;如果之前的警报没有成功发送,则相当于触发第6条条件,则需要等待group_interval时间间隔后重复发送。
以上这些选项都可以在配置文件中修改来进行调整
安装alertmanager,并推送至邮箱 下载并导入alertmanager的镜像,不赘述
1
2
3
4
5
6
7
scp alertmanager.tar.gz ws-k8s-node1:~ scp alertmanager.tar.gz ws-k8s-node2:~ scp alertmanager.tar.gz ws-k8s-node3:~ ssh ws-k8s-node1 "ctr -n=k8s.io import images alertmanager.tar.gz" ssh ws-k8s-node2 "ctr -n=k8s.io import images alertmanager.tar.gz" ssh ws-k8s-node3 "ctr -n=k8s.io import images alertmanager.tar.gz"
自定义alertmanager的cm,对邮箱相关进行设置 1 2 3 4 5 6 7 8 9 10 11 12 13 14 15 16 17 18 19 20 21 22 23 24 25 26 27 28 29 30 31 32 33 34 35 36 37 38 39 40 41 42 43 44 45 46 47 48 49 50 51 52 53 54 55 56 57 58 59 60 61 62 63 64 65 66 67 68 69 70 71 72 73 74 75 76 77 78 79 80 81 82 83 84 85 86 87 mkdir alertmanagercd alertmanager/vim alertmanager-cm.yaml kind: ConfigMap apiVersion: v1 metadata: name: alertmanager namespace: monitor-sa data: alertmanager.yml: |- global: resolve_timeout: 1m smtp_smarthost: 'smtp.163.com:25' smtp_from: 'alertwarning@163.com' smtp_auth_username: 'alertwarning@163.com' smtp_auth_password: 'xxxx' smtp_require_tls: false route: group_by: [alertname] group_wait: 10s group_interval: 10s repeat_interval: 10m receiver: default-receiver receivers: - name: 'default-receiver' email_configs: - to: '1320991378@qq.com' send_resolved: true kubectl apply -f alertmanager-cm.yaml kubectl get cm -n monitor-sa NAME DATA AGE alertmanager 1 16s kube-root-ca.crt 1 45h prometheus-config 1 11h [alertmanager-cfg](https://prod-files-secure.s3.us-west-2.amazonaws.com/1adb32de-ce87-43d3-9ff8-2c6ca7336f75/da5f54b4-5810-475a-b016-89202c0b7b5e/Untitled.txt) [prometheus-alertmanager-deploy](https://prod-files-secure.s3.us-west-2.amazonaws.com/1adb32de-ce87-43d3-9ff8-2c6ca7336f75/bbe0d8fd-ba06-4f8a-875a-e1a82219b82e/Untitled.txt) ```bash ... - job_name: 'kubernetes-etcd' scheme: https tls_config: ca_file: /var/run/secrets/kubernetes.io/k8s-certs/etcd/ca.crt cert_file: /var/run/secrets/kubernetes.io/k8s-certs/etcd/server.crt key_file: /var/run/secrets/kubernetes.io/k8s-certs/etcd/server.key scrape_interval: 5s static_configs: - targets: ['192.168.10.121:2379' ] ... kubectl apply -f prometheus-alertmanager-cfg.yaml 创建alert的secret kubectl -n monitor-sa create secret generic etcd-certs \ --from-file=/etc/kubernetes/pki/etcd/server.key \ --from-file=/etc/kubernetes/pki/etcd/server.crt \ --from-file=/etc/kubernetes/pki/etcd/ca.crt kubectl describe secret etcd-certs -n monitor-sa Name: etcd-certs Namespace: monitor-sa Labels: <none> Annotations: <none> Type: Opaque Data ==== ca.crt: 1094 bytes server.crt: 1212 bytes server.key: 1675 bytes kubectl apply -f prometheus-alertmanager-deploy.yaml kubectl get pods -n monitor-sa | grep pro prometheus-server-6bfd99f866-f2dnb 2/2 Running 0 39s kubectl apply -f alertmanager-svc.yaml kubectl get svc -n monitor-sa NAME TYPE CLUSTER-IP EXTERNAL-IP PORT(S) AGE alertmanager NodePort 10.110.91.131 <none> 9093:30066/TCP 100s prometheus NodePort 10.101.15.38 <none> 9090:31427/TCP 12h 看到对etc已经进行了监控
推送到企业微信 前提:需要让你作为这部分的管理人,不然无法使用
1.注册企业微信
登陆网址:https://work.weixin.qq.com/
找到应用管理,创建应用
创建成功之后显示如下:
1
2
AgentId:1000003 Secret:xxxxxxxx
2.修改alertmanager-cm.yaml
1
2
3
4
5
6
7
8
9
10
11
12
route: group_by: [alertname] group_wait: 10s group_interval: 10s repeat_interval: 3m receiver: "prometheus" receivers: - name: 'prometheus' wechat_configs: to_user: '@all' agent_id: 1000003 api_secret: xxxxxxxx
参数说明:
secret: 企业微信(“企业应用”–>”自定应用”[Prometheus]–> “Secret”)
prometheus监控mysql 监控单机mysql
1
2
3
4
5
6
7
8
9
10
11
12
13
14
15
16
17
18
19
20
21
22
23
24
25
26
27
28
29
30
31
32
33
34
35
36
37
38
39
40
41
42
43
44
45
46
47
1. 在master节点 安装mysql,并解压mysqld-exporter工具二进制程序 cp mysqld_exporter-0.10.0.linux-amd64.tar.gz ~tar -xf mysqld_exporter-0.10.0.linux-amd64.tar.gz 2. 将二进制程序拷贝到/usr/bin目录下 cp mysqld_exporter /usr/3. 登录mysql,创建新用户mysqld_exporter mysql -uroot -h 192.168.10.100 -p 4. 对新用户进行授权 CREATE USER 'mysql_exporter' @'localhost' IDENTIFIED BY 'Admin@123' ; GRANT PROCESS, REPLICATION CLIENT, SELECT ON *.* TO 'mysql_exporter' @'localhost' ; 5. 在目录下创建my.conf文件,将mysql的用户名和密码放进去 cat my.conf[client] user=mysql_exporter password=Admin@123 6. nohup 启动程序,并且指定conf配置文件(默认监听9104端口)ohup ./mysqld_exporter --config.my-cnf=./my.conf & ss -tunlp | grep 9104 tcp LISTEN 0 4096 *:9104 *:* users :(("mysqld_exporter",pid=211669 ,fd=3 )) 7. 修改Prometheus的cfg 添加一个job_name ... - job_name: 'solo-mysql' static_configs: - targets: ['192.168.10.100:9104' ] ... 8. 重新delete与apply,并且热加载 9. 导入grafana针对MYSQL的json
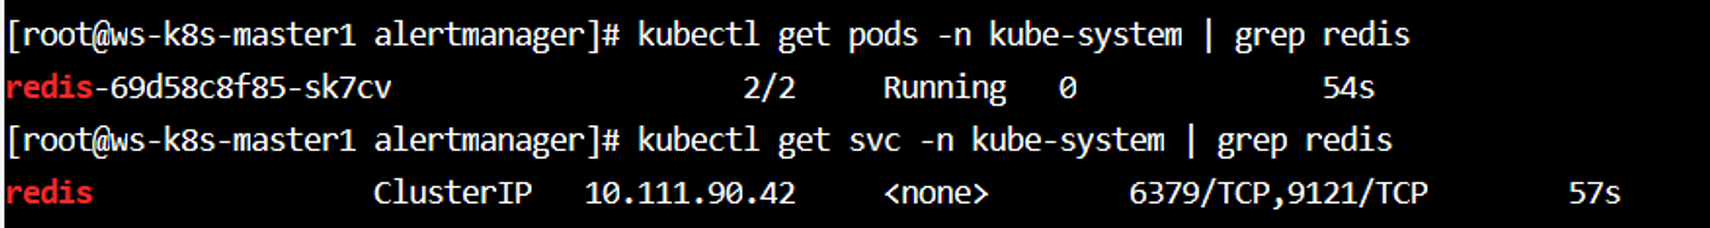
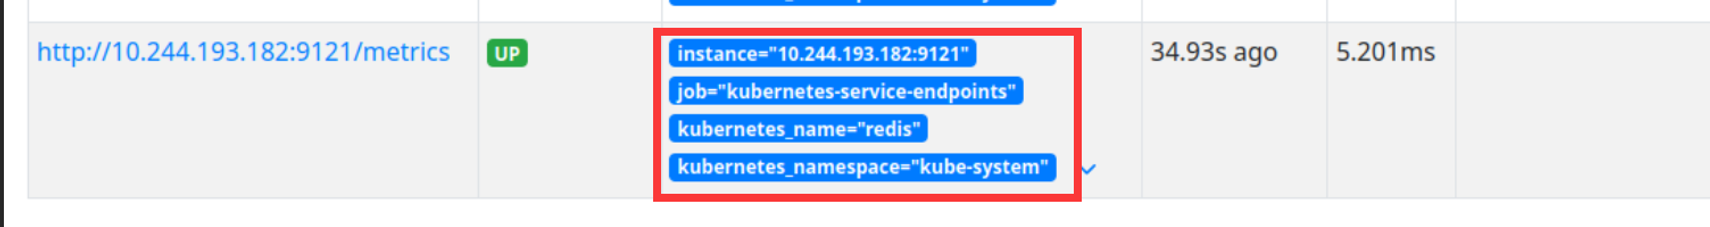
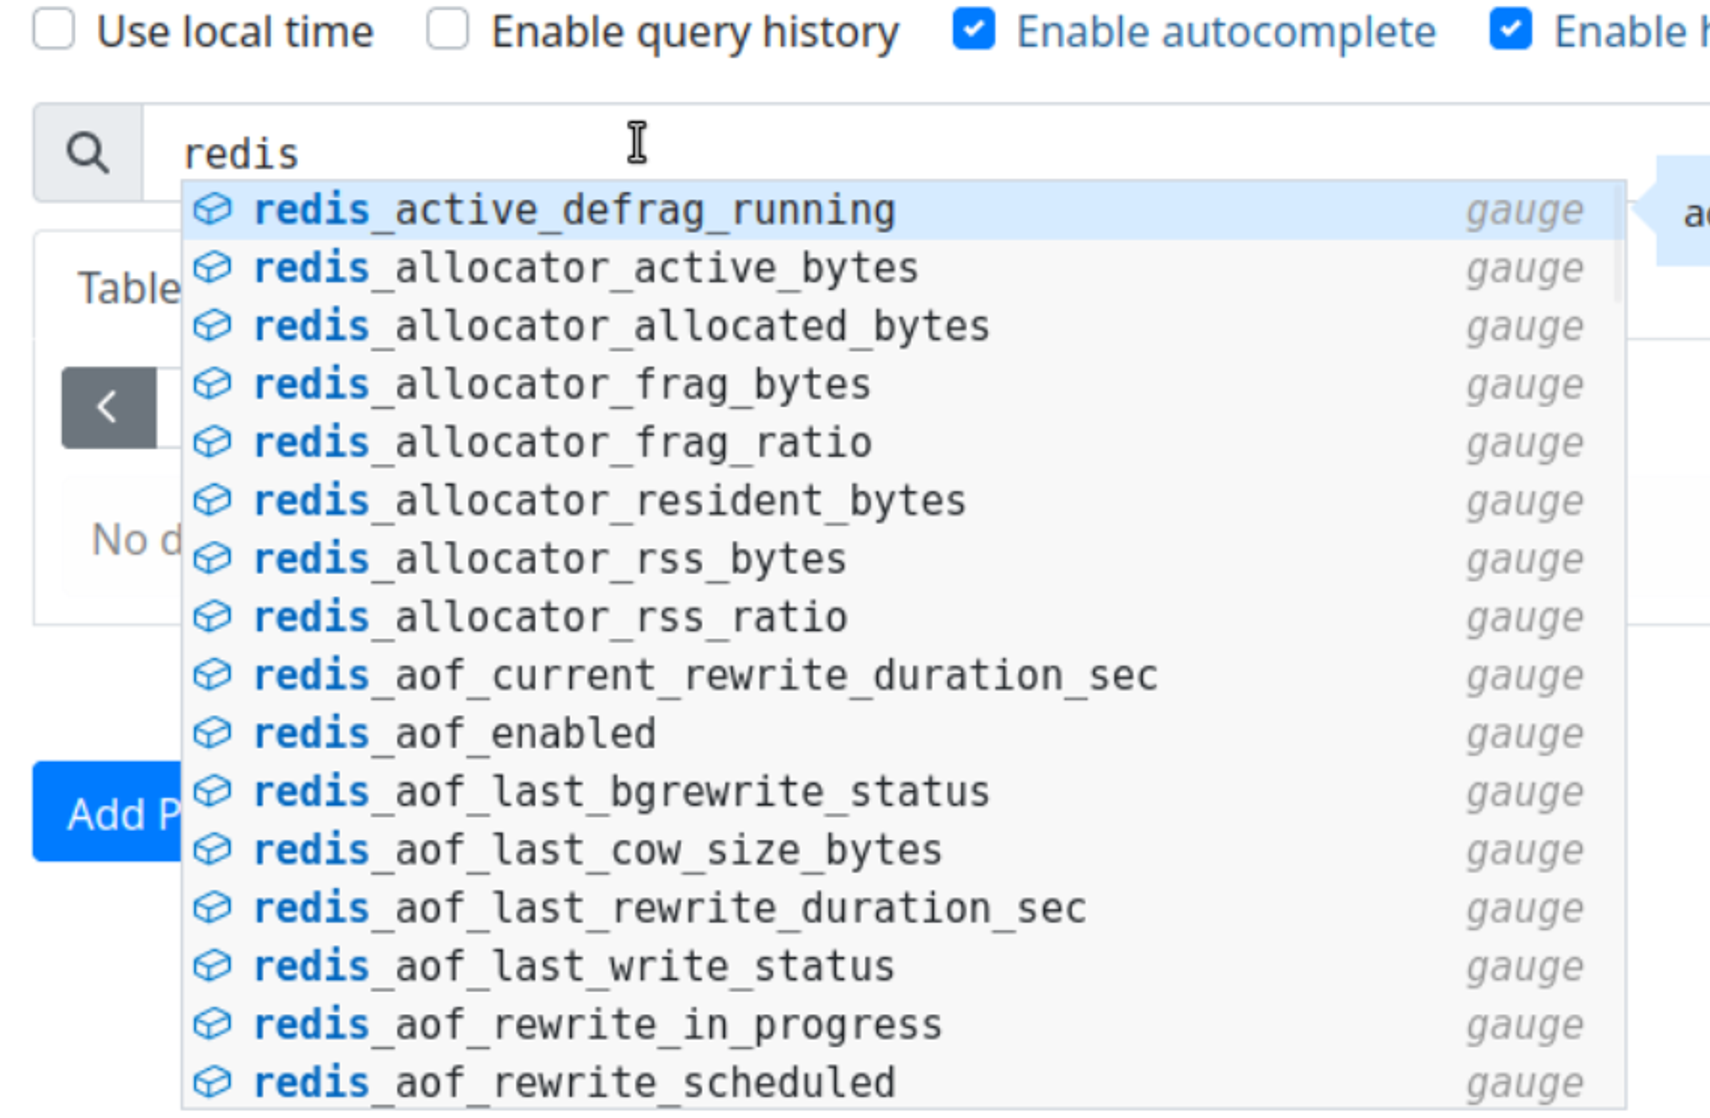
Prometheus监控Redis 部署redis与redis服务发现
1
2
3
4
5
6
7
8
9
10
11
12
13
14
15
16
17
18
19
20
21
22
23
24
25
26
27
28
29
30
31
32
33
34
35
36
37
38
39
40
41
42
43
44
45
46
47
48
49
50
apiVersion: apps/v1 kind: Deployment metadata: name: redis namespace: kube-system spec: replicas: 1 selector: matchLabels: app: redis template: metadata: labels: app: redis spec: containers: - name: redis image: redis:7.2.4 resources: requests: cpu: 100m memory: 100Mi ports: - containerPort: 6379 - name: redis-exporter image: oliver006/redis_exporter:latest resources: requests: cpu: 100m memory: 100Mi ports: - containerPort: 9121 --- apiVersion: v1 kind: Service metadata: name: redis namespace: kube-system annotations: prometheus.io/scrape: "true" prometheus.io/port: "9121" spec: selector: app: redis ports: port: 6379 targetPort: 6379 port: 9121 targetPort: 9121
Prometheus监控nginx(待更新) Pushgateway收集信息 Pushgateway简介:
pushgateway缺点:
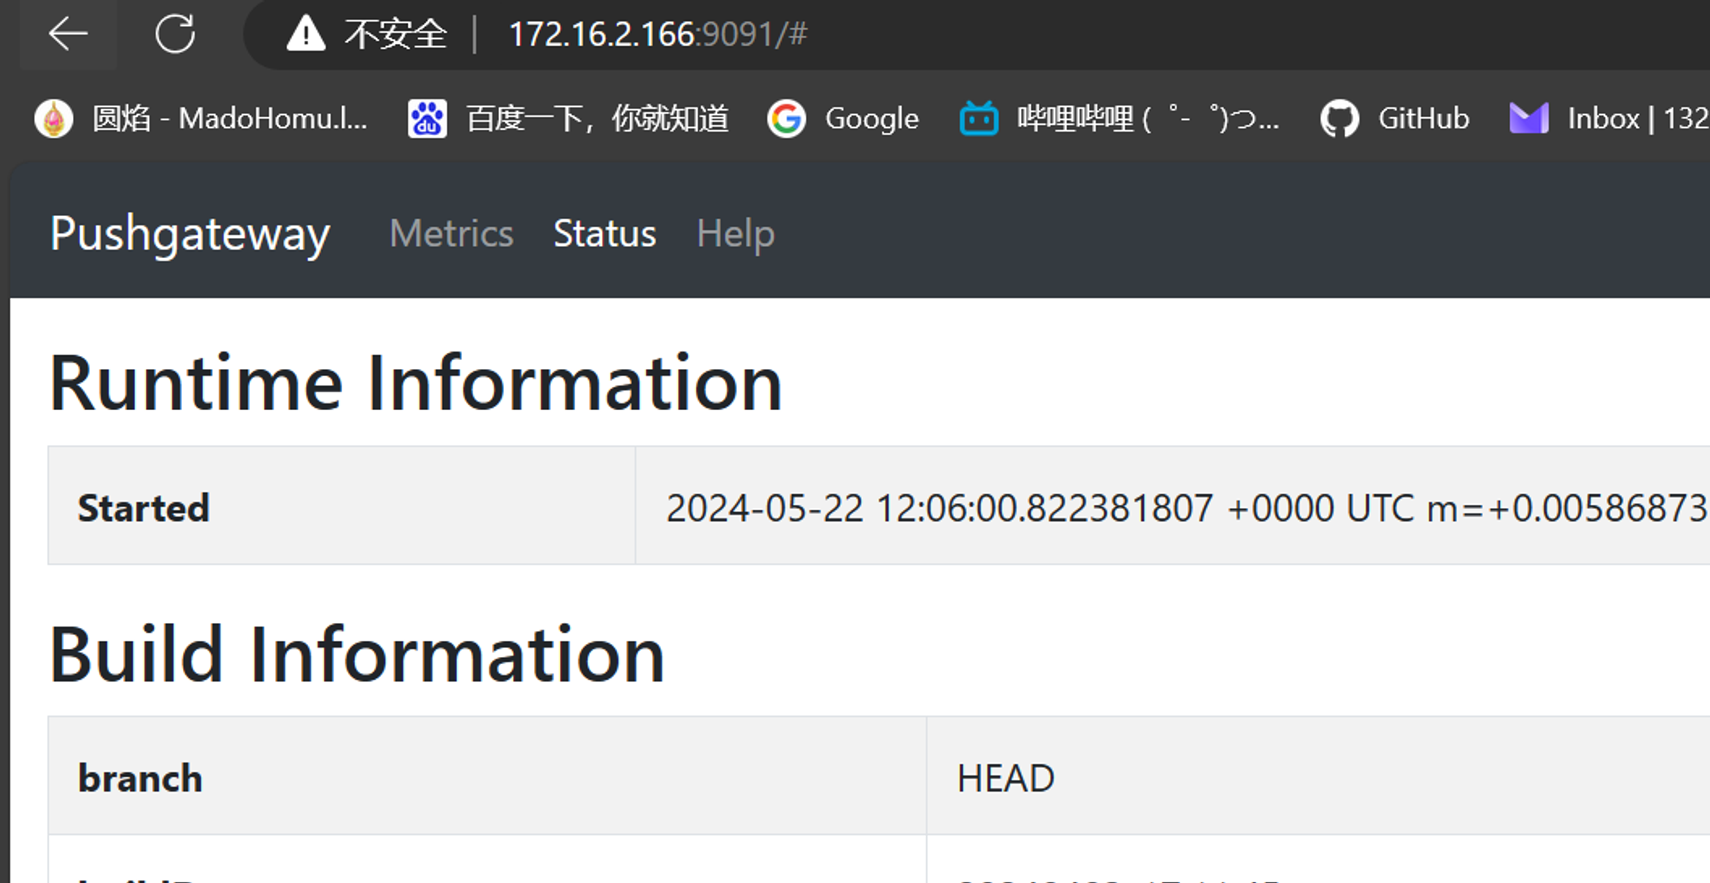
安装pushgateway 1 2 3 4 5 6 7 docker pull prom/pushgateway docker save prom/pushgateway:latest -o pushgateway.tar.gz ctr -n=k8s.io image import pushgateway.tar.gz 容器化运行,我直接在1panel主机运行 docker run -d --name pushgateway -p 9091 :9091 prom/pushgateway 地址为192.168 .10 .100 :9091
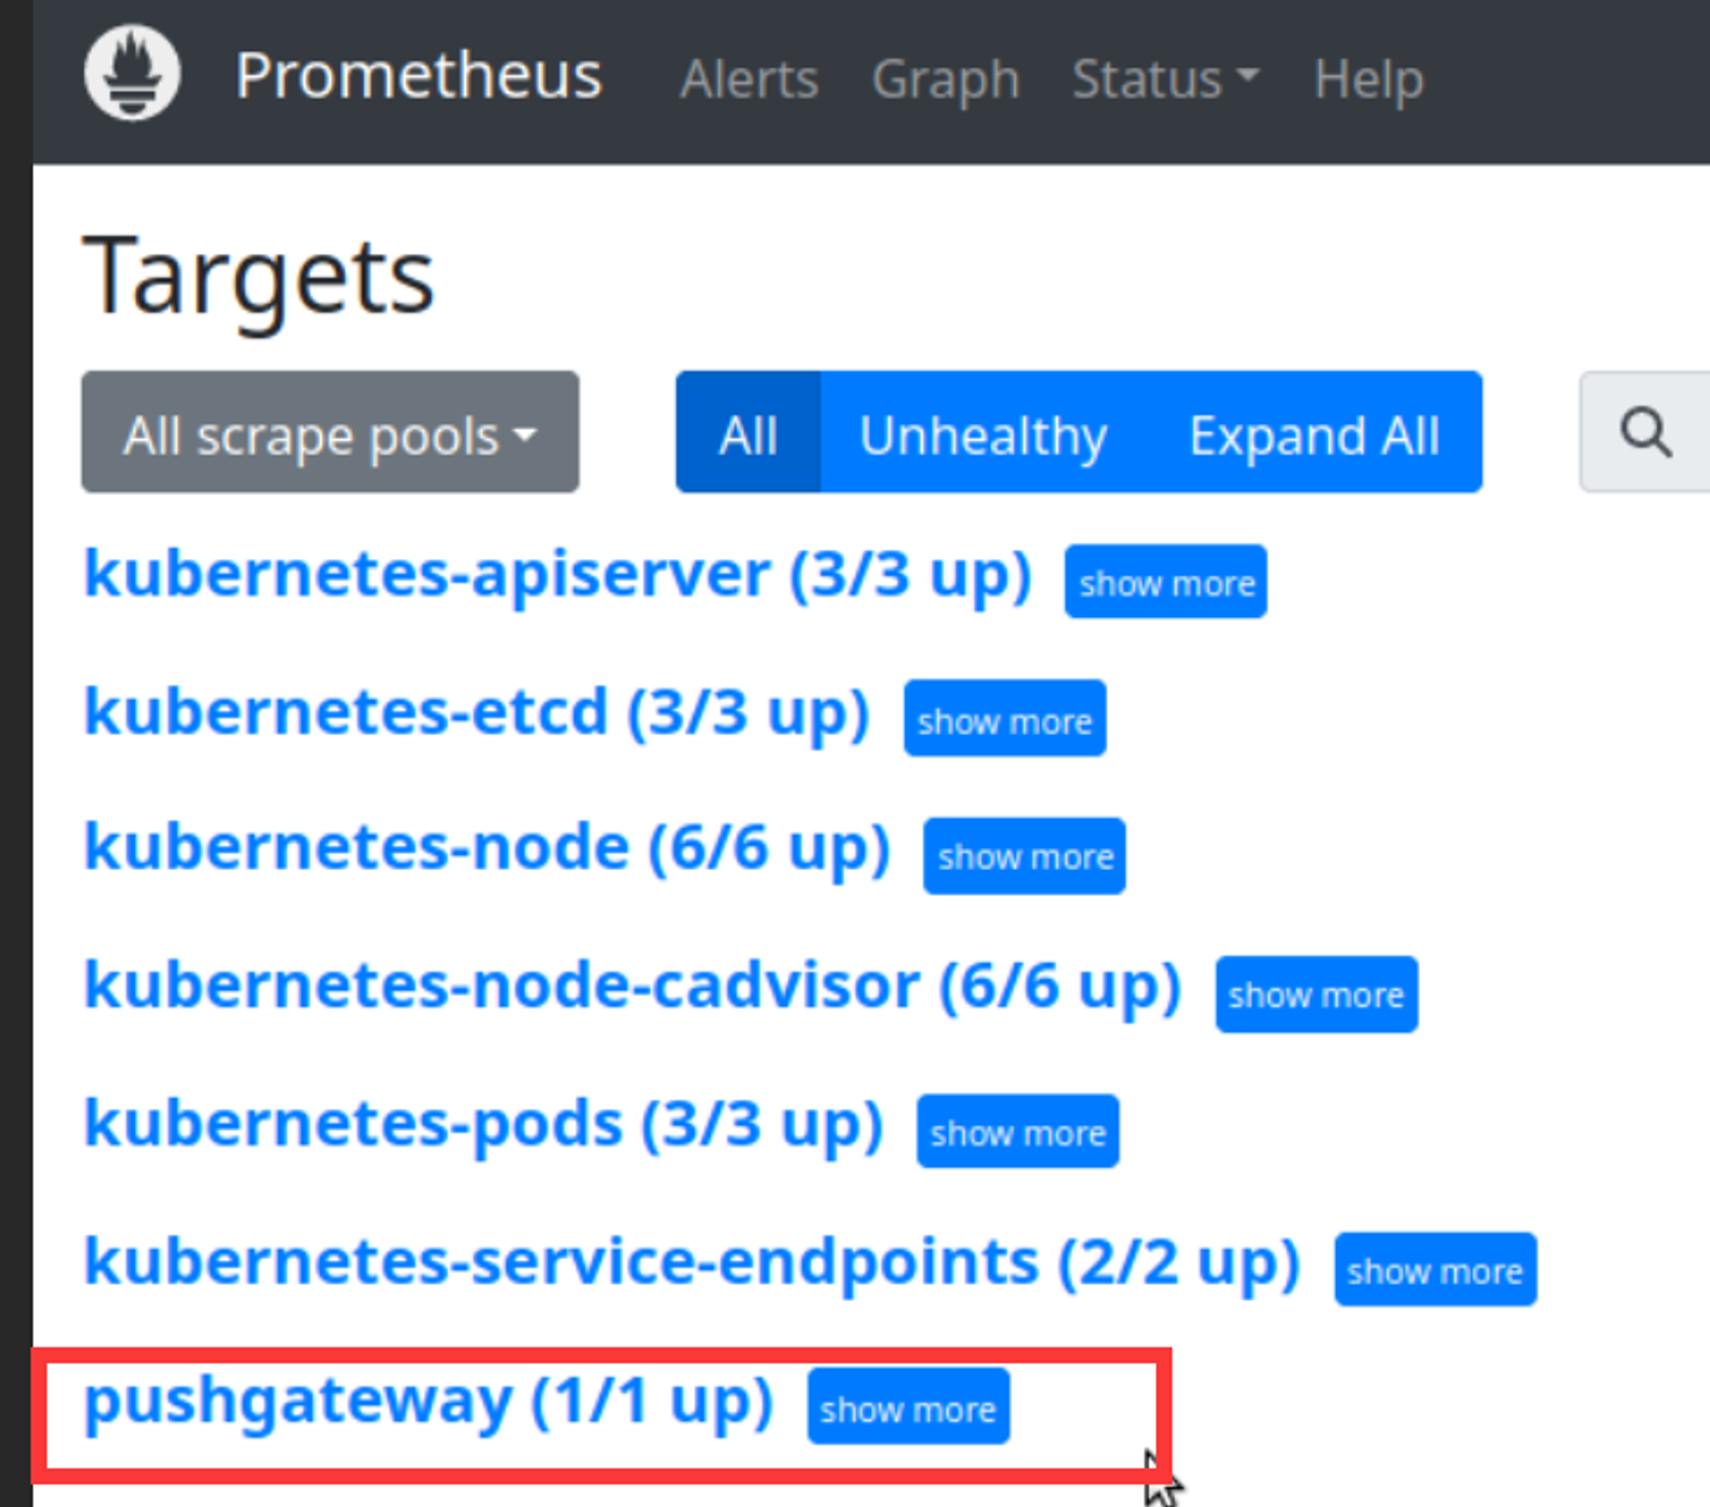
修改Prometheus配置 1 2 3 4 5 6 7 8 9 10 11 12 修改Prometheus-alertmanager-cfg.yaml文件 添加job静态配置,去做服务发现 - job_name: 'pushgateway' scrape_interval: 5s static_configs: - targets: ['192.168.10.100:9091' ] honor_labels: true 设置查询周期为5s kubectl apply -f prometheus-alertmanager-cfg.yaml kubectl delete -f prometheus-alertmanager-deploy.yaml kubectl apply -f prometheus-alertmanager-deploy.yaml
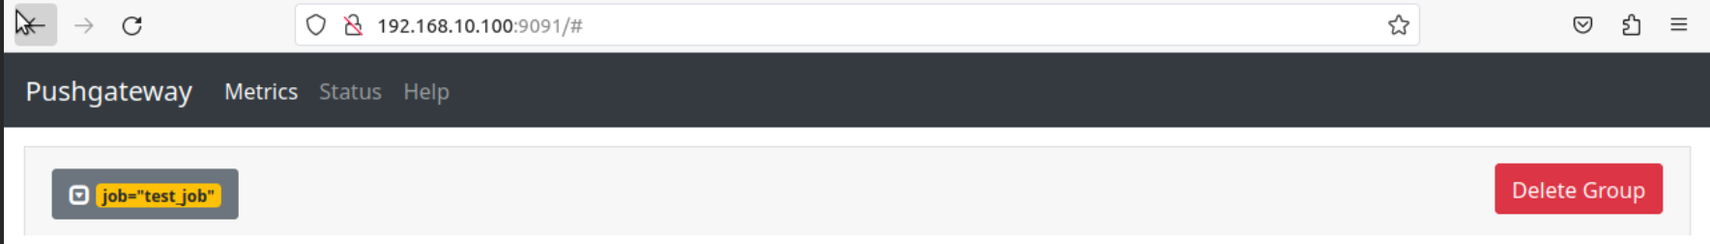
测试 1 2 发送一条测试消息,以二进制向pushgateway发送 echo " metric 3.6" | curl --data-binary @- http://192.168 .10 .100 :9091 /metrics/job/test_job
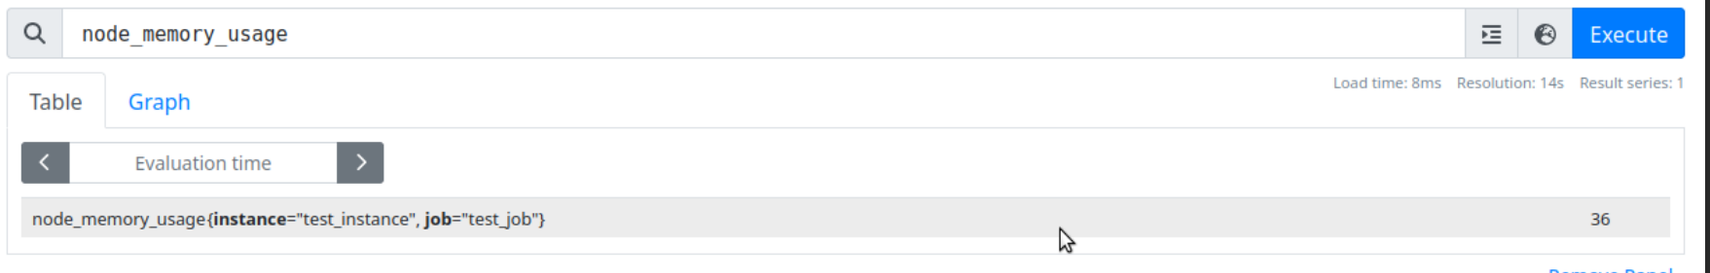
1 2 3 4 5 6 7 8 测试 cat <<EOF | curl --data-binary @- http://192.168 .10 .100 :9091 /metrics/job/test_job/instance/test_instance node_memory_usage 36 node_memory_total 36000 EOF 可以从Prometheus上进行查找
1 2 3 4 5 删除数据 curl -X DELETE http://192.168 .10 .100 :9091 /metrics/job/test_job/instance/test_instance curl -X DELETE http://192.168 .10 .100 :9091 /metrics/job/test_job
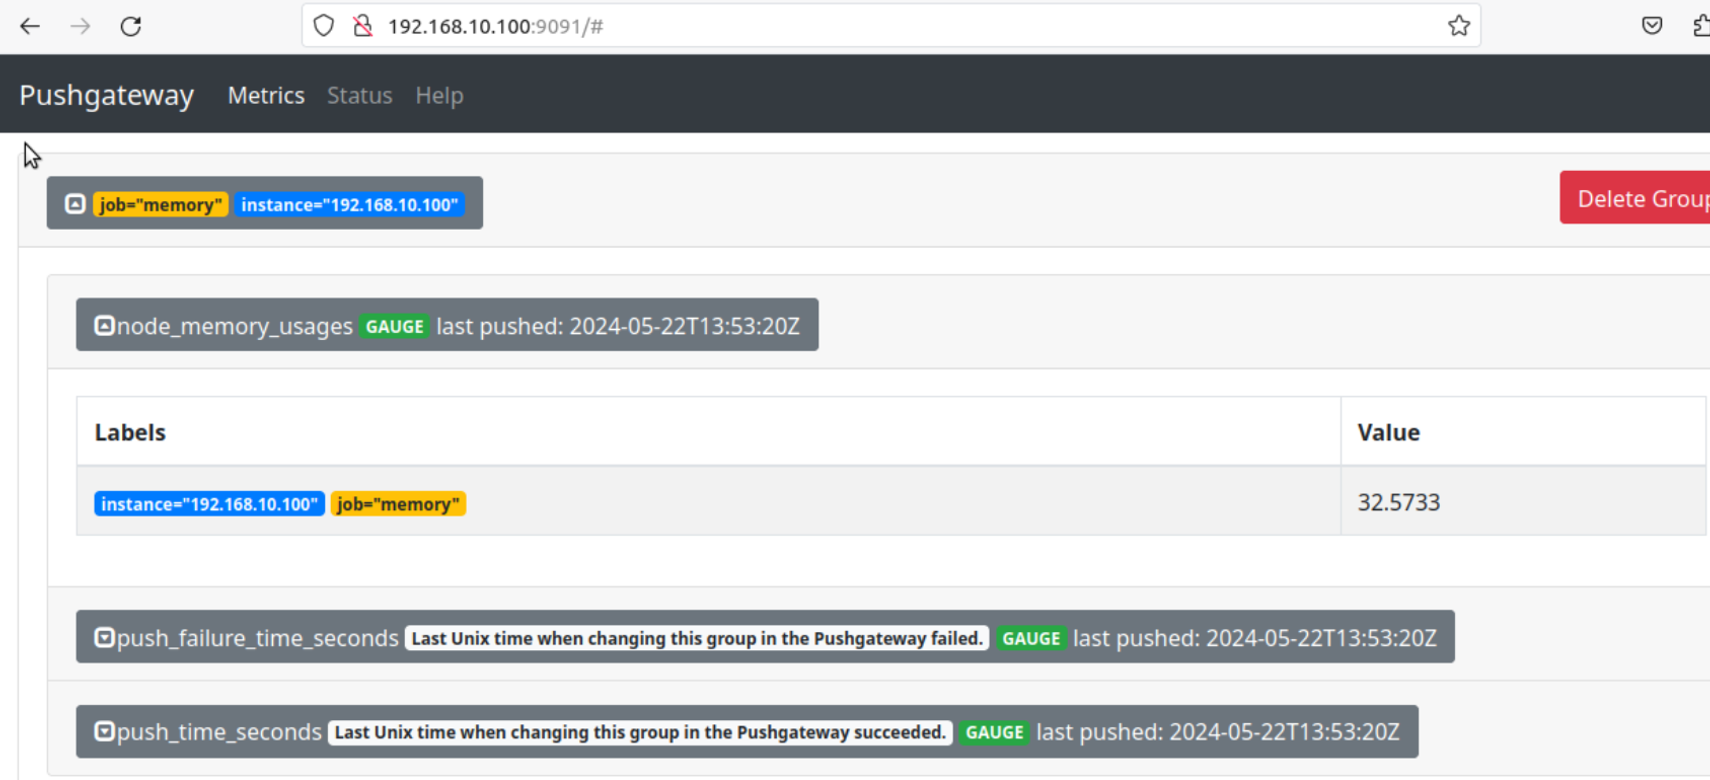
实战 push.sh脚本
1 2 3 4 5 6 7 8 9 10 11 #!/bin/bash node_memory_usages=$(free -m | grep Mem | awk '{print $3/$2*100}' ) job_name="memory" instance_name=$(ip -4 addr show | grep 'inet ' | grep -v 'inet6' | grep -oP 'inet \K[\d.]+' | grep '192.168.10.' | head -n 1) cat <<EOF | curl --data-binary @- http://192.168.10.100:9091/metrics/job/$job_name/instance/$instance_name #TYPE node_memory_usages gauge node_memory_usages $node_memory_usages EOF 通过Cronjob+脚本的方式就可以定时上报信息